Natural Gas Forecast: July Poised to Rise to $2.57

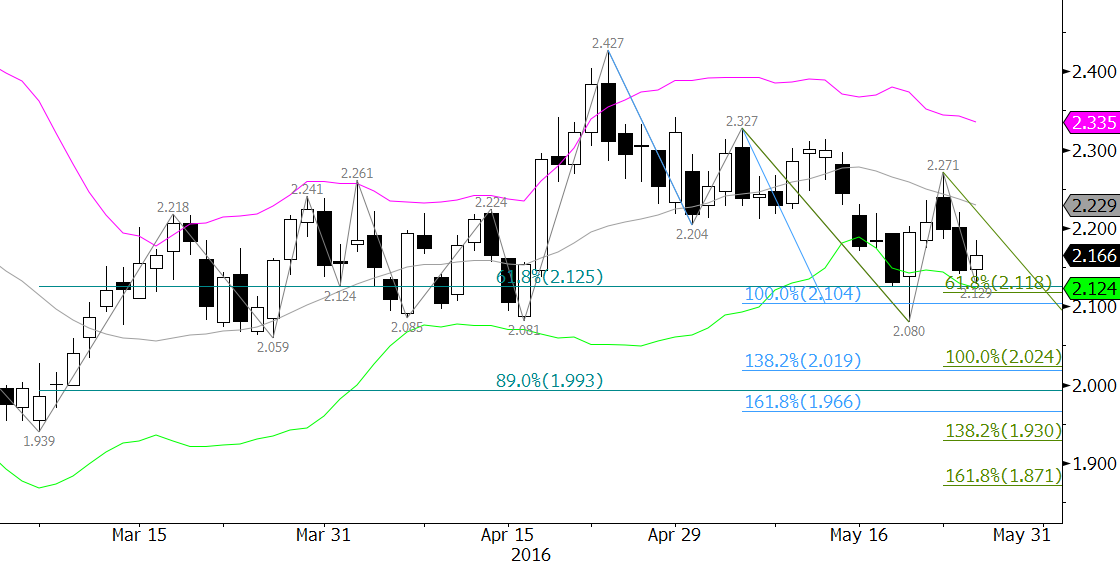
Prompt month natural gas futures have risen just over 20 percent after the June contract’s expiration last Thursday. Reports indicate traders are expecting increased demand for the fuel due to warmer than normal summer weather in coming weeks. Technical factors have also turned positive and call for rising prices to challenge and likely overcome the 2016 highs made in early January.

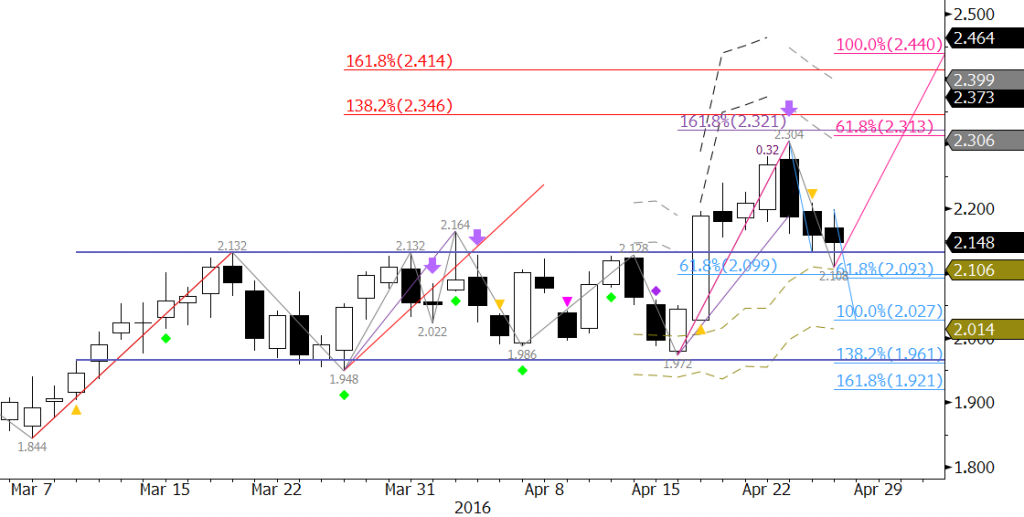
The technicals turned positive last week, ahead of the June contract’s expiration, when July natural gas held crucial support at $2.13 on a closing basis. This was the 62 percent retracement of the move up from July’s $1.939 contract low to $2.427. The spread between June and July had weighed on July, but once June expired, July was primed to rise to challenge key resistance levels this week.

NGN6 20160601

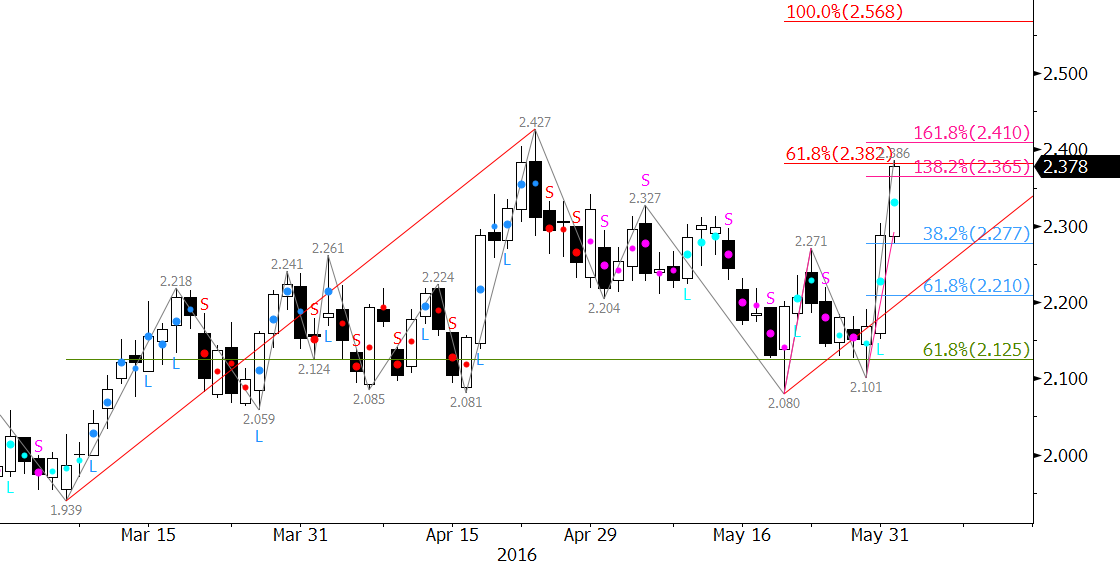
Tuesday’s close over $2.22 opened the way for key resistance at $2.38. This is the 0.618 projection for the wave $1.939 – 2.427 – 2.08. Waves that meet the 0.618 target normally (75-80 percent of the time) rise to at least the 1.00 projection. Therefore, now that $2.38 has been met, odds ultimately favor at least $2.57, the 1.00 projection.

That said, the confluence of targets near $2.38 indicates it may hold, at least initially. Any move down at this point is likely corrective of the move up, and a pullback should hold $2.27 and no lower than $2.20. Ultimately, we expect July to close over $2.38 and rise toward $2.57 within the next few weeks.

This is a brief natural gas forecast for the next day or so. Our weekly Natural Gas Commentary is a much more detailed and thorough analysis. If you are interested in learning more, please sign up for a complimentary four-week trial.

The spread between the June and July contracts ahead of June’s expiration on Thursday has weighed on the front of the market. However, July natural gas challenged crucial support at $2.13 Wednesday and held this level on a closing basis while June stalled again near key support at $1.95. The longer-term is beginning to look more positive for natural gas, and once June expires, July is poised to rise toward key resistance at $2.31.

Wednesday’s close over $2.17, the midpoint of Tuesday, was positive for the near-term. Tomorrow, look for July to test $2.21. A close over this would then call for $2.25 and $2.31. Overcoming $2.31 would open the way for an extended move higher.

NGN6 20160525

Trading will likely remain choppy for the next few days, especially ahead of the holiday weekend, and $2.13 is still crucial support. It is in line with projections for the waves down from $2.427 and $2.327. It is also near the 62 percent retracement of the move up from $1.939 to $2.427 and is the close of May 18. A close below $2.13 would call for $2.08 and possibly $2.00. July might test a bit lower, but we still do not see evidence that July will fall lower than $2.00.

This is a brief natural gas forecast for the next day or so. Our weekly Natural Gas Commentary is a much more detailed and thorough analysis. If you are interested in learning more, please sign up for a complimentary four-week trial.

Reports indicate traders and investors have been focused on the return of crude oil from recent worldwide supply disruptions, primarily in Canada and Nigeria, in addition to swelling output from Iran. The rising U.S. dollar has also put bearish pressure on prices after the Fed’s latest policy meeting notes suggested a June rate hike possible.

From a technical standpoint, WTI reached significant targets just below $50.0 late last week before forming daily bearish divergences and daily hanging men. These factors indicate the move up is exhausted. However, so far, July WTI’s decline from $49.56 has been extremely choppy and is most likely corrective.

The correction has held the 38 percent retracement from $43.65 to $49.56, but is positioned to extend a bit lower. There is highly confluent support at $46.8, which will likely be met before the move up continues. A close below $46.8 would call for an extended correction to $45.6.

CLN6 20160523

That said, the move up from $47.4 on Monday shows that prices should test $48.6 early Tuesday before attempting $46.8 again. This level should hold, but a close over $48.6 would open the way for $49.2. A close over $49.2, would indicate the downward correction is most likely over and call for $50.2 and higher.

In summary, look for a test of $47.4 followed by $46.8. A close beyond either of these levels will give the market a better sense of near-term direction and how low the correction will extend before prices ultimately turn higher again.

This is a brief analysis and outlook for the next day or so. Our weekly Crude Oil Commentary is a much more detailed and thorough energy price forecast. If you are interested in learning more, please sign up for a complimentary four-week trial.

Supply disruptions due to wildfires in Alberta and militant attacks in Nigeria were reportedly offsetting rising stockpiles of crude oil and surging OPEC output. However, those factors seem to be easing, and may not have as much of an impact on supply as originally indicated.

U.S. crude inventories reached their highest level since 1929, but rig counts continue to decline and U.S. output reportedly dropped the most in eight months during the week ended April 29.

Some analysts and traders believe the move up may have been too much too fast, and that the market is taking a much needed breather after rising four weeks in a row prior to last week. Sentiment is also becoming more negative, indicating the move down should extend.

June WTI crude oil challenged key resistance at $46.1 a few times over the past several days. This level has held so far, and should continue to hold as the corrective move down extends. The wave formations down from $46.78 and $46.07 indicate June should decline to at least $42.5. This is a confluent wave projection and the last major swing low. A close below $42.5 would call for $42.0 and lower.

crude oil
crude oil

That said, at this point, we do not foresee that prices will fall apart. We expect trading to remain choppy. Look for $44.3 to hold upon a test of resistance early tomorrow before the decline continues. Crucial resistance for tomorrow is $44.9. We doubt prices will rise this high unless spurred by random events. Key resistance remains $46.1. A close above $46.1 would indicate the correction is over, and in turn, open the way for the next leg higher.

This is a brief analysis and outlook for the next day or so. Our weekly Crude Oil Commentary is a much more detailed and thorough energy price forecast. If you are interested in learning more, please sign up for a complimentary four-week trial.

Natural gas continues to send mixed signals on a day-to-day basis. However, that is pretty typical for this time of year during the shoulder months ahead of summer. Natural gas is trying to gauge the prospects of a recovery or a continued decline over the course of the longer-term, but it needs to gather more information first. With all current factors considered, it is looking like natural gas is settling into another trading range, though the boundaries of the range are still being determined.

For now, odds still favor a decline. June natural gas met the 0.618 projection for the wave $2.304 – 2.042 – 2.195 at $2.026 on Monday. Waves that meet the 0.618 projection typically extend to the 1.00 projection, in this case $1.93. Therefore, unless $2.195 is overcome, odds ultimately favor $1.93.

NGM6 20150504
natural gas

That said, the wave up from $2.026, aided by today’s close over $2.14, shows potential to extend to its 1.618 projection of $2.19. This is near the $2.195 swing high and the 62 percent retracement of the decline from $2.304 to $2.026. A move above $2.195 would take out the wave down from $2.304 that projects to $1.93 and lower, and in turn, shift odds in favor of $2.28 and higher.

First support is $2.06, the 0.618 projection of the wave $2.195 – 2.026 – 2.16. A close below this would take out the wave up from $2.026 and the near-term potential of overcoming $2.195. This would also open the way for another attempt at $2.00 and lower.

The key over the next few days will be either a move above $2.195 or below $2.061. As stated, odds favor the decline, but it is a very tight call right now.

This is a brief natural gas forecast for the next day or so. Our weekly Natural Gas Commentary is a much more detailed and thorough analysis. If you are interested in learning more, please sign up for a complimentary four-week trial.

The crude oil price surge over the last few weeks was reportedly due to slipping U.S. production, a weaker U.S. dollar, and several production outages. However, some pundits are growing concerned that swelling OPEC output could keep the market oversupplied and turn prices lower.

The move up stalled near a highly confluent $46.0 target late last week, and June WTI challenged crucial support at $44.5 on Monday. This is near the 1.00 projection of the wave $46.78 – 45.24 – 46.15, and is in line with the prior swing high of $44.49.

CLM6 20160502
crude oil

In addition, Friday’s bearish Harami line and star was confirmed and several bearish divergences were triggered on Monday.

At this point, there is no strong technical evidence that the pullback will end. Therefore, the move down should extend to at least $43.7, $42.9, and possibly $41.9 over the next few days

That said, at this point the move down is corrective, and unless the $42.5 swing low is taken out, longer-term odds will favor the move up. A close over the $46.15 swing high will shift near-term odds back in favor of $48.0.

This is a brief analysis and outlook for the next day or so. Our weekly Crude Oil Commentary is a much more detailed and thorough energy price forecast. If you are interested in learning more, please sign up for a complimentary four-week trial.

After breaking higher out of the recent trading range between nominally $1.96 and $2.13, June natural gas stalled at $2.304. This was just below important resistance at $2.33, which connects to $2.43.

Monday’s bearish engulfing line and confirmed divergence (purple down arrow on KaseX) called for a test of $2.13. This was strong resistance between March 18 and April 18 and has now become support. So far, this level has held on a closing basis.

NGM6 20160427
June natural gas

Tomorrow’s EIA Natural Gas Storage Report is expected to show around a +70 Bcf build. This is higher than the +52 Bcf five-year average, and could aid in dropping prices below $2.13 again. A sustained close below $2.13 would call for $2.03 and $1.96 where range bound trading may again ensue.

That said, the small move up from $2.108 late Wednesday may extend in early trading before the EIA report is released. Unless there is a much smaller than expected build reported by the EIA tomorrow, there is a cluster of resistance between $2.18 and $2.23 that should hold. A close over $2.23, the 62 percent retracement from $2.304 to $2.108, would call for $2.33 to be attempted again.

This is a brief natural gas forecast for the next day or so. Our weekly Natural Gas Commentary is a much more detailed and thorough analysis. If you are interested in learning more, please sign up for a complimentary four-week trial.

Late last week, June WTI crude oil challenged key resistance at $44.5. This is a confluence point, and most importantly, the 1.618 projection of Wave I (not shown), $30.79 – 38.52 – 32.1. A close over $44.5 will open the way for the next leg higher, which could push WTI crude oil prices into the upper $40s and possibly the low $50s.

That said, a small double top formed near $44.5 on Friday and was confirmed Monday upon the close below $43.05. The confirmed double top and waves down from $44.49 and $44.45 call for the pullback to extend to at least $42.1 and likely a confluence area near $41.6.

CLM6 20160425
crude oil

The move down has been shallow and choppy though, indicating it is most likely corrective of the move up. Unless $41.6 is taken out on a sustained closing basis, we still expect prices to attempt to overcome $44.5 again. A move above $43.3 in early trading tomorrow would call for $43.8 and possibly $44.5.

This is a brief analysis and outlook for the next day or so. Our weekly Crude Oil Commentary is a much more detailed and thorough energy price forecast. If you are interested in learning more, please sign up for a complimentary four-week trial.

For the past few weeks, May natural gas has oscillated in a range between approximately $1.86 and $2.06. The market looks as though it wants to break higher after closing over Monday’s gap down from $1.99 on Tuesday and sustaining a close above $2.00 on Wednesday.

May natural gas is working its way toward the crucial $2.06 target again after stalling early on Wednesday at $2.051. Support held and prices recovered late, but formed an evening star setup on the daily chart.

NGK6 20160413

It is still a very tough call, but currently, odds favor another test of $2.06 on Thursday. A close over this would call for $2.10 and likely $2.14 where there is a cluster of wave projections. However, keep in mind the move up is likely weather driven right now and corrective of the longer-term decline. Therefore, without help from external factors, the market will be hard pressed to overcome $2.14.

Initial support at $1.98 should hold on Thursday, but crucial support will be $1.94. A close below $1.94 does not doom the prospects of the move up, but would open the way for a test of the key $1.86 level.

This is a brief natural gas forecast for the next day or so. Our weekly Natural Gas Commentary is a much more detailed and thorough analysis. If you are interested in learning more, please sign up for a complimentary four-week trial.

The highly anticipated and headline grabbing April 17 meeting between OPEC and non-OPEC nations has set the stage for crude oil’s rally. However, some traders and pundits still think the world is awash in oil and an out-put freeze has already been priced in. They anticipate an agreement to freeze production—if reached—would have little near-term impact.

Others believe slipping U.S. oil production is the most likely and more logical culprit for the price rise and could continue to lead the way higher. In addition, the sliding U.S. dollar and Federal Reserve officials’ optimistic statements on Friday morning regarding the U.S. economy and flat interest rates have also been interpreted as bullish.

From a technical standpoint the move up is poised to continue. Last week, WTI held the 62 percent retracement of the move up from $30.67 to $42.49 when prices fell to $35.24. This was important because the move up from $30.67 forms Wave III of a potential five-wave pattern. WTI is now forming a potential Wave V, but must overcome key resistance at $42.8 to prove that is the case. $42.8 is a confluent projection for Waves I and III, so a close over this would shed a much more bullish light on WTI.

CLK6 20160411

Look for initial resistance at $40.9 and $41.6. These are important projections for the wave up from $35.24 and potential stalling points. We expect to see at least a small pullback (21 to 38 percent retracement) once $41.6 is met. A close over $41.6 will significantly increase the odds of challenging $42.8,

Look for support at $38.7 and $37.3. A close below $37.3 would indicate the move up has likely failed, and that another test of $35.2 will take place.

This is a brief analysis and outlook for the next day or so. Our weekly Crude Oil Commentary is a much more detailed and thorough energy price forecast. If you are interested in learning more, please sign up for a complimentary four-week trial.