The highly anticipated and headline grabbing April 17 meeting between OPEC and non-OPEC nations has set the stage for crude oil’s rally. However, some traders and pundits still think the world is awash in oil and an out-put freeze has already been priced in. They anticipate an agreement to freeze production—if reached—would have little near-term impact.
Others believe slipping U.S. oil production is the most likely and more logical culprit for the price rise and could continue to lead the way higher. In addition, the sliding U.S. dollar and Federal Reserve officials’ optimistic statements on Friday morning regarding the U.S. economy and flat interest rates have also been interpreted as bullish.
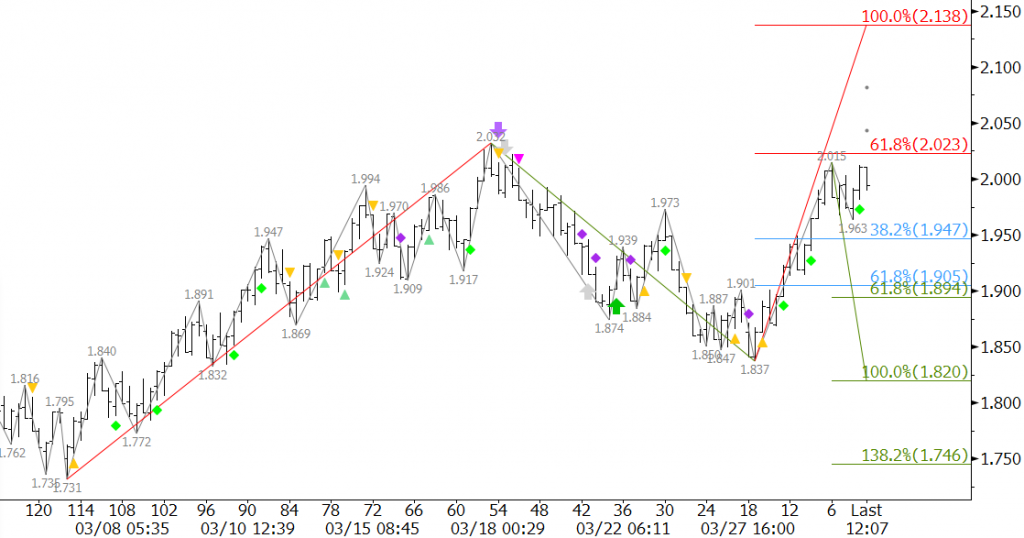
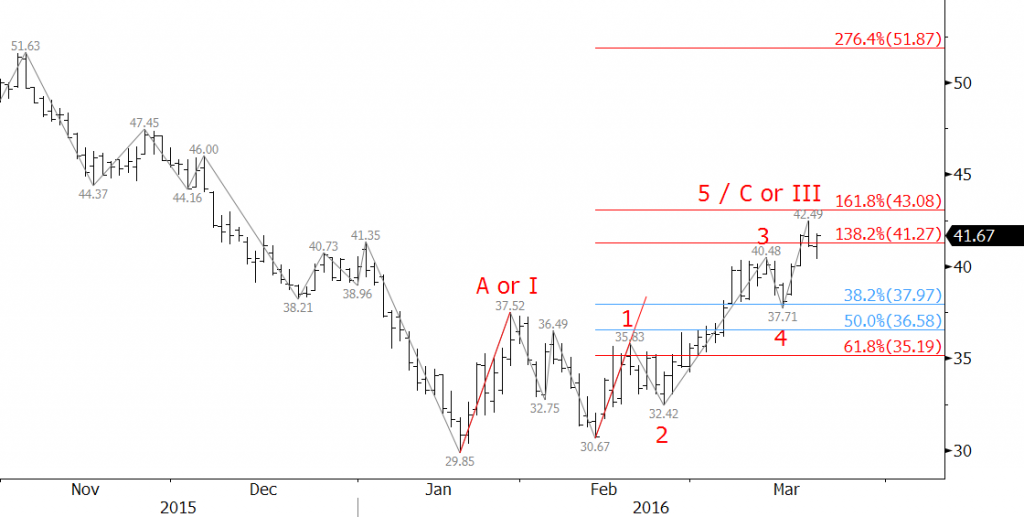
From a technical standpoint the move up is poised to continue. Last week, WTI held the 62 percent retracement of the move up from $30.67 to $42.49 when prices fell to $35.24. This was important because the move up from $30.67 forms Wave III of a potential five-wave pattern. WTI is now forming a potential Wave V, but must overcome key resistance at $42.8 to prove that is the case. $42.8 is a confluent projection for Waves I and III, so a close over this would shed a much more bullish light on WTI.
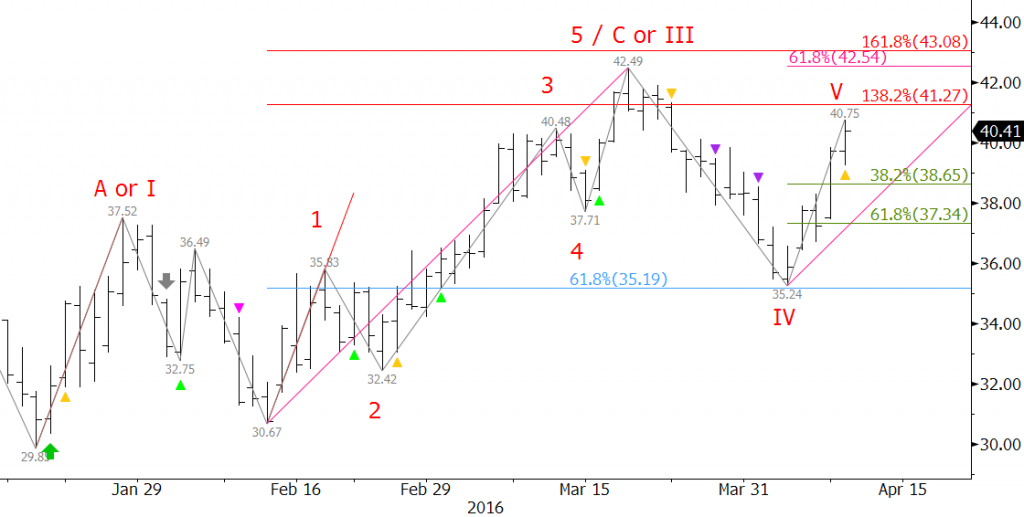
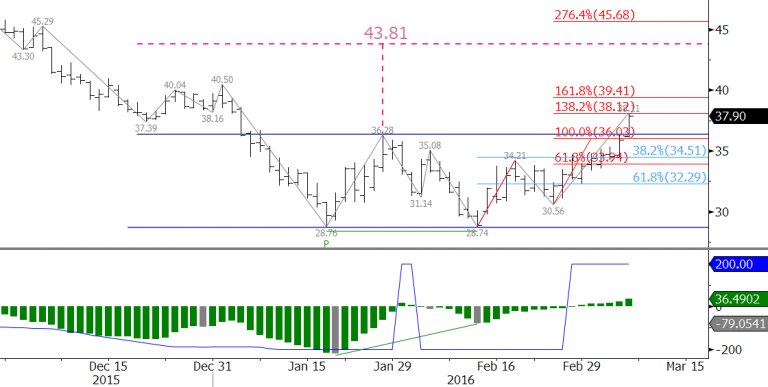
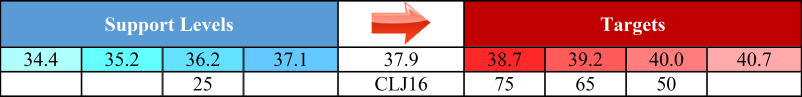
Look for initial resistance at $40.9 and $41.6. These are important projections for the wave up from $35.24 and potential stalling points. We expect to see at least a small pullback (21 to 38 percent retracement) once $41.6 is met. A close over $41.6 will significantly increase the odds of challenging $42.8,
Look for support at $38.7 and $37.3. A close below $37.3 would indicate the move up has likely failed, and that another test of $35.2 will take place.
This is a brief analysis and outlook for the next day or so. Our weekly Crude Oil Commentary is a much more detailed and thorough energy price forecast. If you are interested in learning more, please sign up for a complimentary four-week trial.