WTI Crude Oil Technical Analysis and Short-Term Forecast
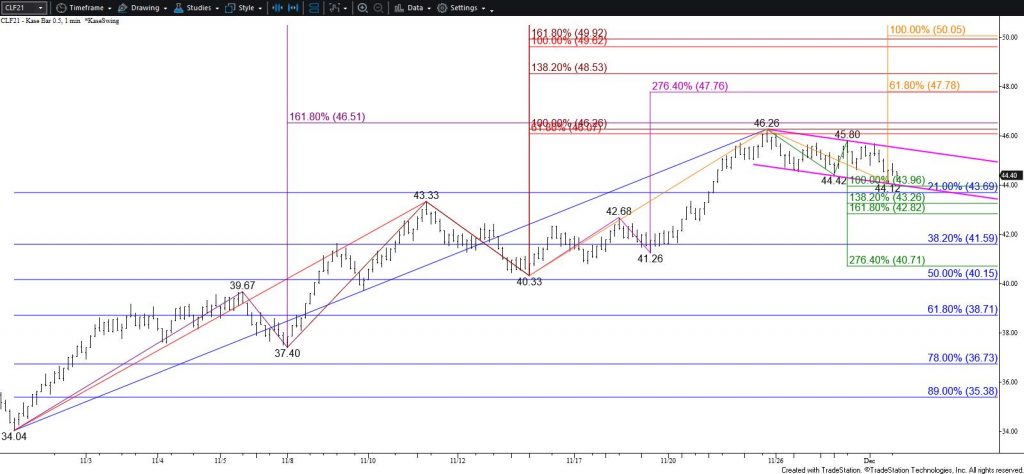
The long-term outlook for WTI crude oil is bullish. However, a confirmed daily RSI divergence and daily bearish doji suggest the pullback from $46.68 should extend a bit lower before the move up continues. Today’s decline to $45.14 fulfilled the equal to (1.00) target of the primary wave down from $46.68. The subsequent move up to $45.93 has been lackluster so far. Another test of $46.1 is expected, a close below which will clear the way for $44.4 and possibly $43.9 during the next few days.
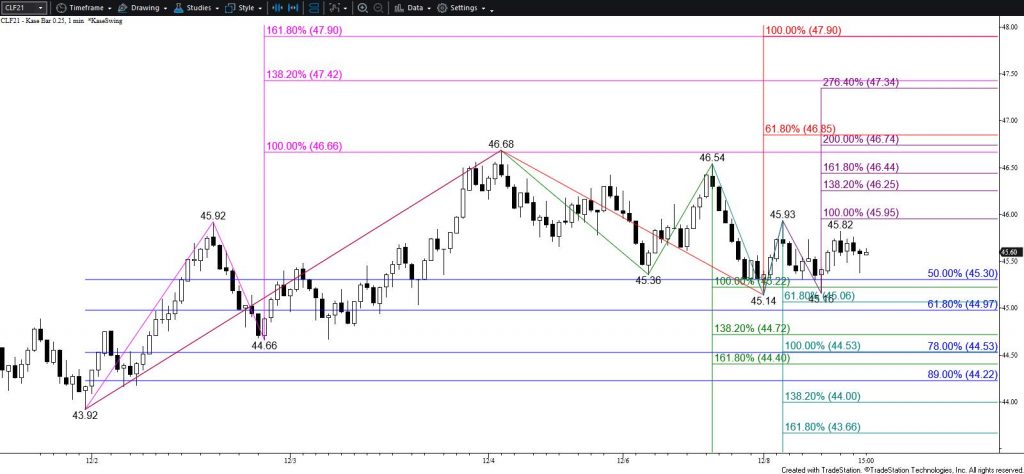
With that said, this has become a very tight call because of a small intra-day double bottom that formed between today’s $45.14 and $45.16 swing lows. The wave up from $45.14 has overcome its smaller than (0.618) target, which implies that the double bottom’s $45.93 confirmation point will likely be challenged early tomorrow. Closing above $45.93 will confirm the double bottom and clear the way for $46.4 and possibly $46.9.
Resistance at $46.4, which the 62 percent retracement of the decline from January’s $58.92 swing high is expected to hold. Nonetheless, $46.9 is most important for the near-term outlook because this is in line with the double bottom’s target and the smaller than target of the wave up from $43.92. Settling above $46.9 would confirm that the corrective pullback is over and would open the way for the next leg of the move up to unfold.
This is a brief analysis for the next day or so. Our weekly Crude Oil Forecast and daily updates are much more detailed and thorough energy price forecasts that cover WTI, Brent, RBOB Gasoline, Diesel, and spreads. If you are interested in learning more, please sign up for a complimentary four-week trial.