WTI Crude Oil Technical Analysis and Short-Term Forecast
This is a brief analysis for the next day or so. Our weekly Crude Oil Forecast and daily updates are much more detailed and thorough energy price forecasts that cover WTI, Brent, RBOB Gasoline, Diesel, and spreads. If you are interested in learning more, please sign up for a complimentary four-week trial.
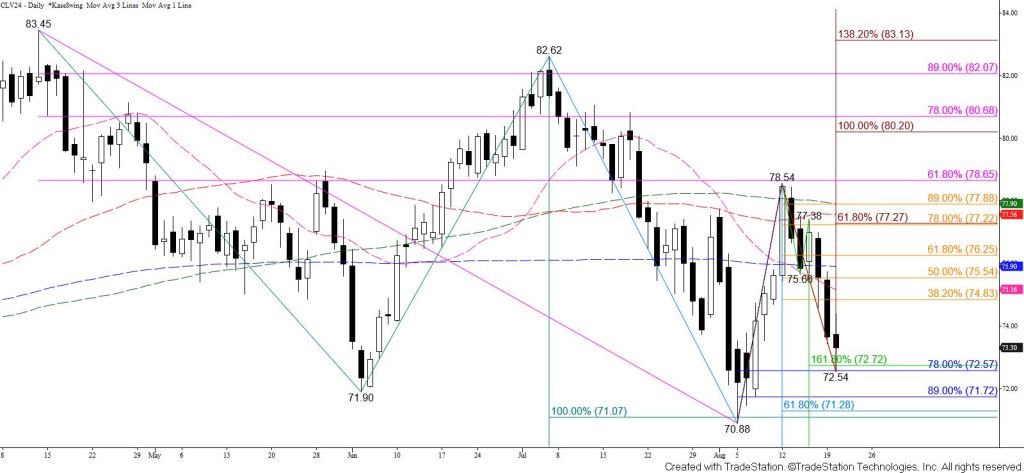
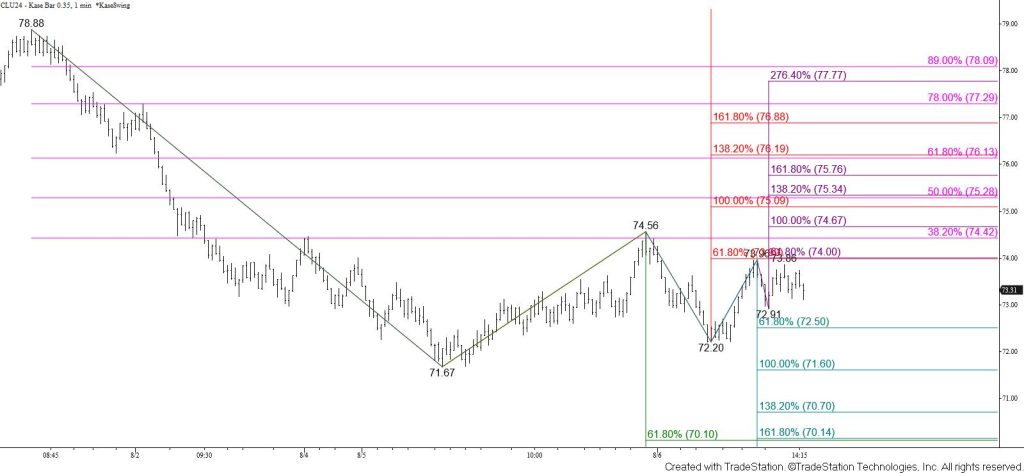
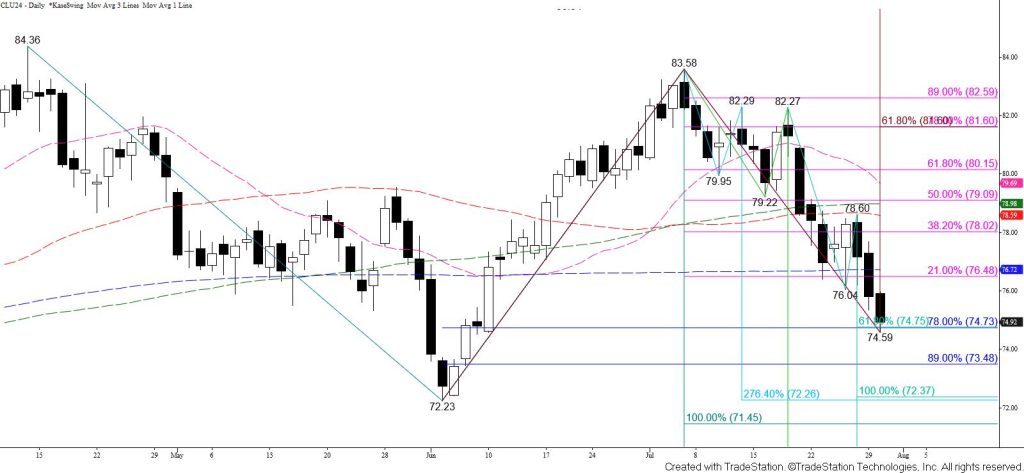
WTI crude oil settled below the 62 percent retracement of the rise from $70.88 and the intermediate (1.382) target of the first wave down from $78.54. This was bearish for the outlook because the close below the 62 percent retracement implies that the move up from $70.88 is a completed correction and has increased the likelihood that a long-term bearish decision point at $71.2 will be tested again.
The 78 percent retracement and larger than (1.618) target around $72.6 were tested and held on a closing basis today. Another test of $72.6 is expected within the next day or so. Closing below $72.6 will call for a minor target at $71.8 that connects to the long-term bearish decision point at $71.2. The $71.2 objective is most important because it is the smaller than (0.618) target of the wave down from the $84.32 October contract high, the equal to (1.00) target of the wave down from $83.45, the smaller than target of the wave down from $82.62, and the 62 percent retracement of the rise from $64.38. A sustained close below $71.2 will open the potential for a decline into the mid-to-low $60s in the coming months.
Nevertheless, the confluence of $72.6 makes this a level from which a test of resistance might take place before the move down extends and tests $71.2. Today’s long upper and lower candlestick shadows also reflect a bit of near-term uncertainty. A further move up from $72.54 will likely be a correction and is expected to hold key near-term resistance at $74.8. Overcoming $74.2 will call for a test of $74.8. Settling above $74.8 would warn that the move down from $78.54 is failing.