Gold Technical Analysis and Near-Term Outlook
This is a brief analysis for the next day or so. Our weekly Metals Commentary and daily updates are much more detailed and thorough energy price forecasts that cover key COMEX precious metals futures contracts and LME Non-Ferrous (Base) metals, spot gold, the gold/silver ratio, and gold ETFs. If you are interested in learning more, please sign up for a complimentary four-week trial.
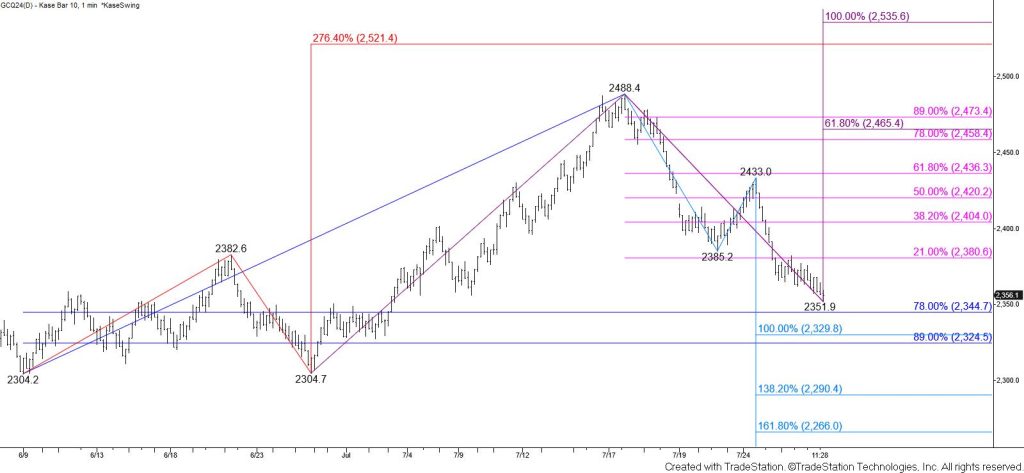
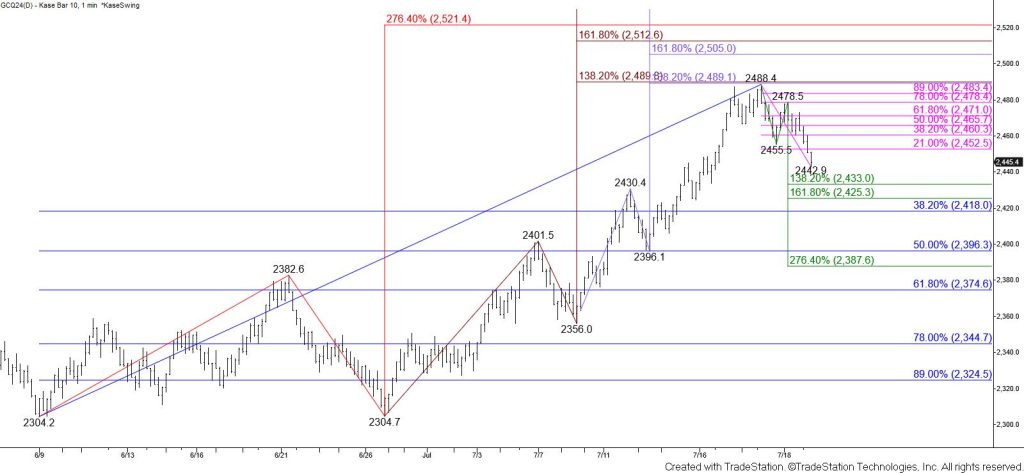
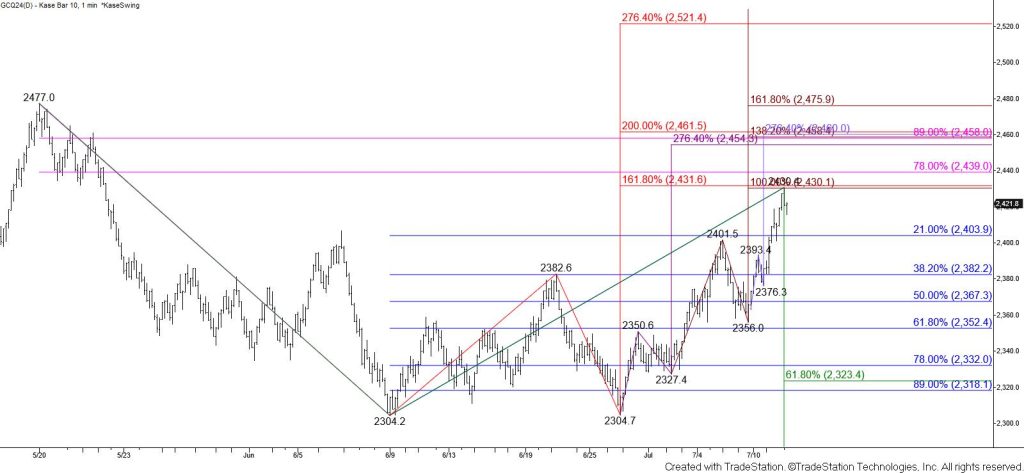
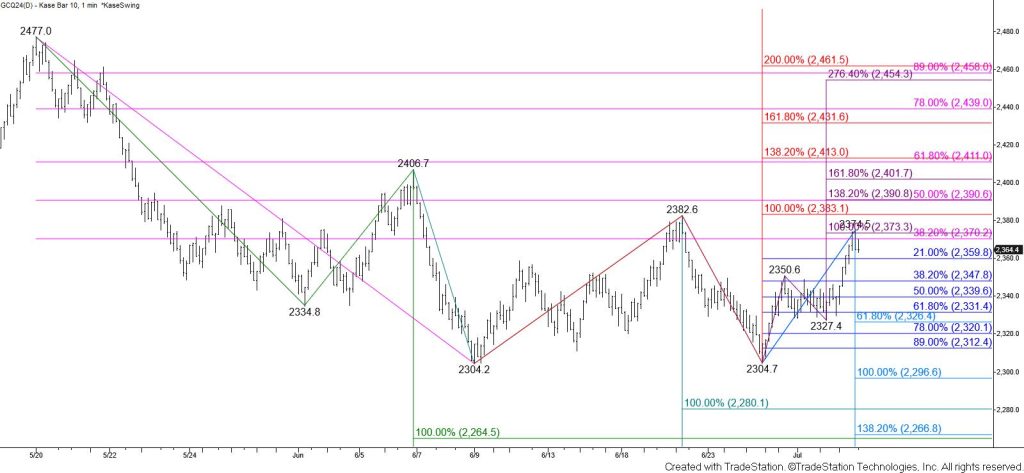
Gold settled below the smaller than (0.618) target of the primary wave down from $2488.4 and the 62 percent retracement of the rise from $2304.2 today. Today’s move down also caused the daily Kase Trend indicator to become bearish and for the 10-day DMI to trigger a bearish crossover. Daily bearish KasePO and RSI divergences were also confirmed at the $2488.4 swing high and there has been good follow-through after last week’s formation of a shooting star.
The move down is now poised to reach the $2328 equal to (1.00) target of the wave down from $2488.4. Settling below this will call for another test of the $2304 level, a close below which would call for the $2290 intermediate (1.382) target and eventually the $2263 larger than (1.618) target. The $2263 objective is also a major retracement of the moves up from $1900.1 and $2306.
There are no bullish patterns or signals that call for the move down to stall before reaching $2328. Nonetheless, should gold rise tomorrow look for initial resistance at $2372 to hold. Overcoming this would call for key near-term resistance and the 38 percent retracement of the decline from $2488.4 at $2402 to be challenged.