
WTI Crude Oil Technical Analysis and Short-Term Forecast
The near-term outlook for November WTI crude oil leans bullish after holding the 100-day moving average for the second straight day and holding the 50 percent retracement of the rise from $36.58 on a closing basis. This is a tight call though, and today’s long-legged doji reflects uncertainty headed into tomorrow.
Nevertheless, the wave formation up from $38.87 is poised to test its $40.1 smaller than (0.618) target. This then connects to a key objective at $40.6 as the equal to (1.00) target. The $40.6 objective is also the 62 percent retracement of the decline from $41.72. Settling above $40.6 will clear the way for $41.2 and then $42.1. The $42.1 objective is most important because this is the smaller than target of the primary wave up from $36.58. Settling above $42.1 will put odds firmly in favor of higher prices.
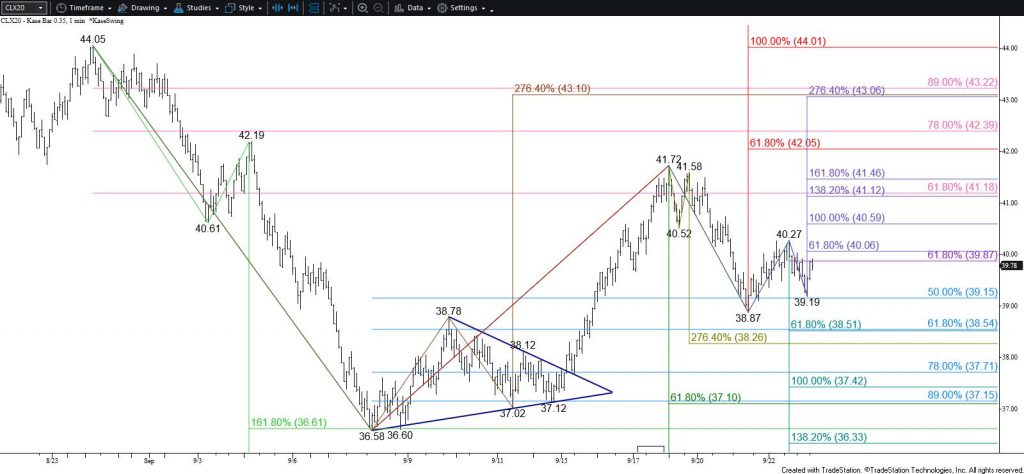
With that said, the late move up from $39.19 stalled near the 62 percent retracement of the decline from $40.27. Also, the choppy nature of today’s move up from $38.87 implies that today’s price action might be corrective of the move down from $41.72. Should WTI fall below $39.1, look for a test of crucial support at $38.5. This is the smaller than target of the primary wave down from $41.72 and the 62 percent retracement of the rise from $36.58. Settling below this will significantly dampen odds for a continued rise and would call for key near-term support at $37.2. This is in line with the smaller than target of the primary wave down from $44.05. Settling below $37.2 would confirm a bearish outlook for WTI in the coming weeks.
Brent Crude Oil Technical Analysis and Short-Term Forecast
Brent crude oil settled below the 100-day moving average for the second straight day. This was bearish for the outlook, but today’s long-legged doji reflects uncertainty after Monday’s decline. Also, the 62 percent retracement of the rise from $39.3 at $41.0 has held and the wave up from $40.96 is poised to challenge its $42.0 smaller than (0.618) target. Rising above this will call for $42.5, which then connects to $43.2 and higher.
Conversely, the move up from $40.96 has been rather choppy and may prove to be a correction. Should Brent take out $41.0 look for a test of $40.3. Settling below $40.3 would call for another test of key support and the barrier to a longer-term bearish outlook at $39.3.
This is a brief analysis for the next day or so. Our weekly Crude Oil Forecast and daily updates are much more detailed and thorough energy price forecasts that cover WTI, Brent, RBOB Gasoline, Diesel, and spreads. If you are interested in learning more, please sign up for a complimentary four-week trial.