Kase Forecasts of the Week – Spot Gold and S&P 500 Index

By Dean Rogers

Spot Gold (XAU)

The long-term outlook for gold is still reasonably promising after prices rallied from a six-year low in December. However, from a technical standpoint, the decline from the 1263.48 swing high is poised to challenge support targets before the move up continues.

KaseX triggered a strong short entry signal called a pierced dart (gray down arrow and yellow triangle) on February 15. On that same day a bearish Harami line and star was completed. The subsequent pullback to 1240.02 held the 1263.48 swing high and was followed by a confirming short signal on Monday, February 22. Monday’s decline also completed another bearish Harami line and star. These factors call for the decline to continue for the near-term.

Gold Daily Candlestick ChartGold Chart

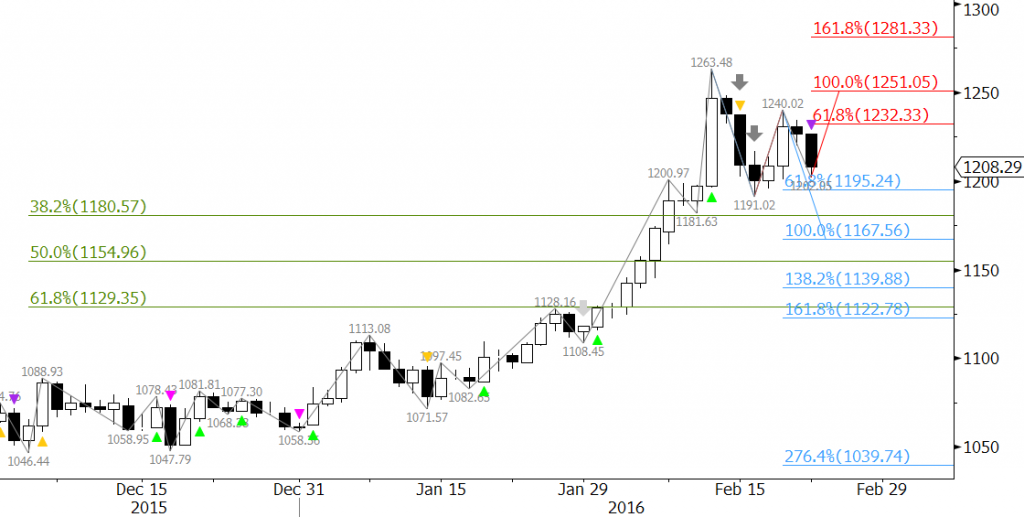
The primary wave that the move down formed, 1263.48 – 1191.02 – 1240.02, projects to 1194.5 as the 0.618 target. Most waves that meet the 0.618 projection extend to at least the 1.00 projection, which in this case is near the 1163.6 confluence point. 1163.6 is the decision point for a larger correction to 1126.2 and possibly lower. A close below 1163.6 would significantly dampen the likelihood of a continued rise, and a close below 1126.2 would shift the long-term outlook to negative.

Gold Table

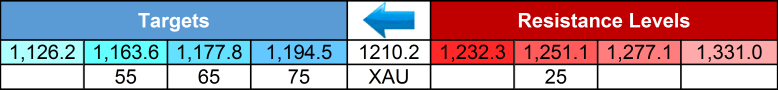
First resistance is 1232.3. This is currently the 0.618 projection of the small wave up from 1191.02. A close over this would call for 1251.1, the 1.00 projection. As it stands, odds are 25 percent for a close over 1251.1 before at least 1194.5 is met. A close over 1251.1 would indicate that the move up should extend to at least 1277.1 and possibly 1331.0 and higher.

S&P 500 Index (SPX)

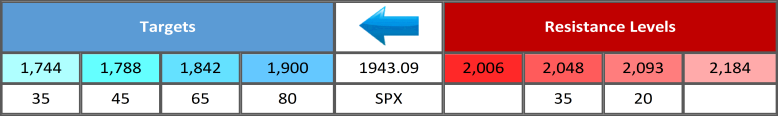
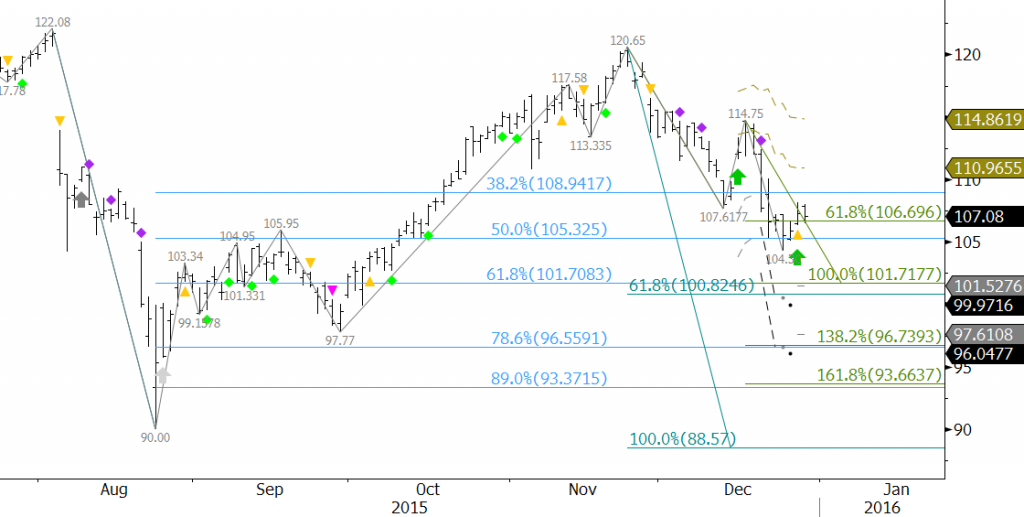
The S&P 500’s rally from a double bottom at 1810.1 has been relatively strong and is challenging the completion point of the formation at 1947.2. This is significant because a close over 1947.2 would complete the double bottom and open the way for a potential rally to the formation’s 2084.0 target.

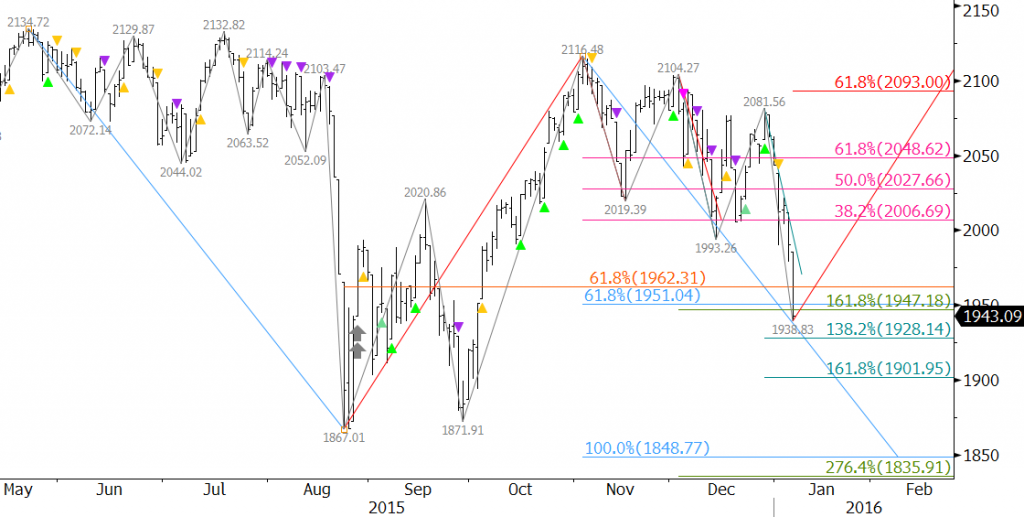
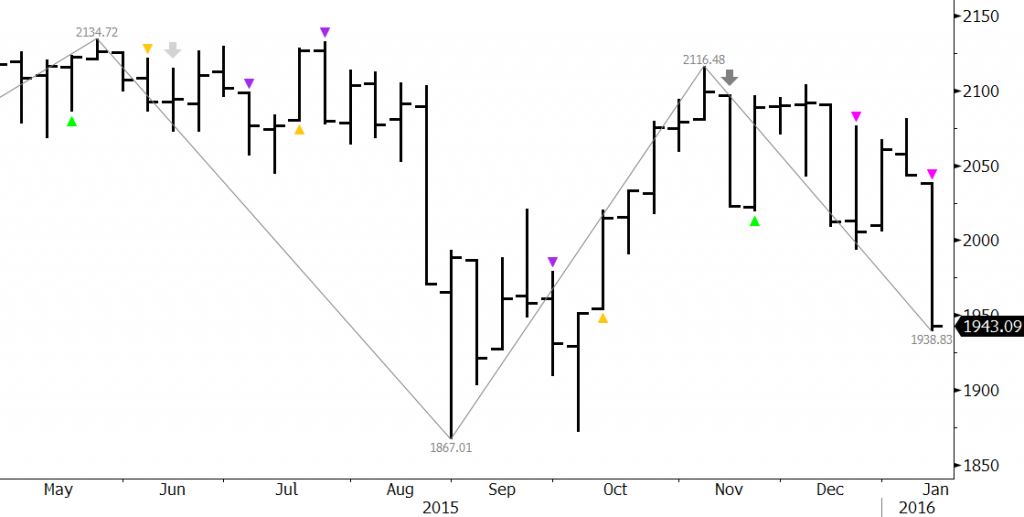
S&P 500 Index Daily ChartSPX Chart

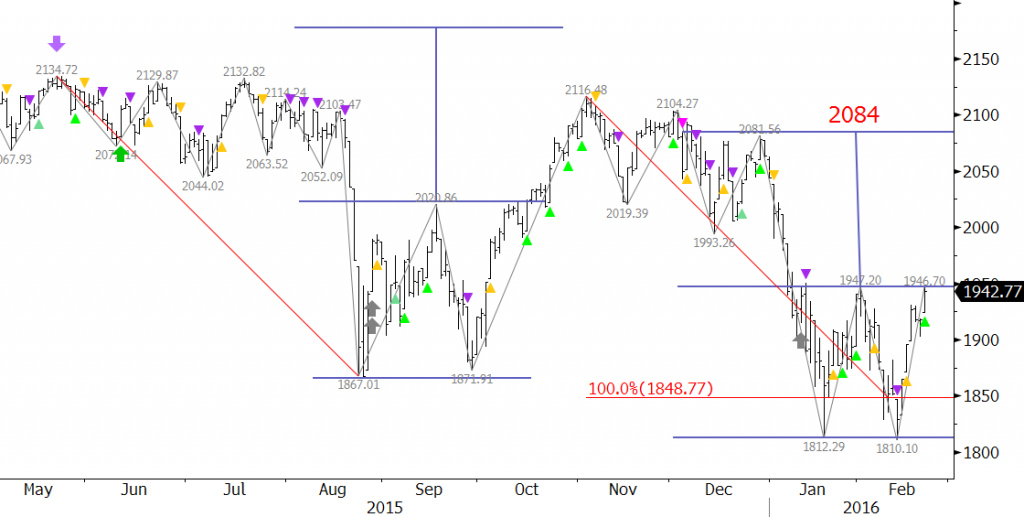
A similar double bottom had formed in late 2015 and was completed when the index closed over 2020.86. The ensuing move fell short of this double bottom’s 2177.0 target, but was still substantial. We could see a similar type of rally upon a close over 1947.2 that falls short of the 2084 target, but challenges key resistance before the decline continues.

Other technical factors, such as wave projections and retracements, call for at least 1971.6. This then connects to 2019.7, 2057.7, and finally 2084.

SPX Table

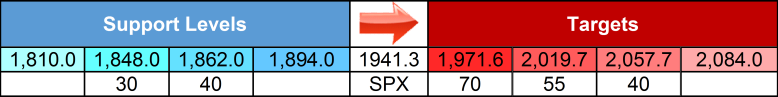
The move down stalled just below a key support level at 1849. This was the 1.00 projection of the wave 2134.72 – 1867.01 – 211.48. The index only closed for one day below this level, so this is still crucial support.

A normal correction of the move up should hold 1894.0 and must hold 1862. These are the 38 and 62 percent retracements from 1810.1 to 1946.7. Key support is 1848, and a close below this would shift the outlook back to negative and call for 1810 and lower again.

These are brief technical analyses with a 10-day outlook based upon Kase’s technical forecasting models and trading indicators KaseX and Kase StatWare. If you are interested in taking a trial of KaseX or Kase StatWare please contact sales@kaseco.com. We would love to get your thoughts about the forecasted targets and probabilities. Leave a comment or send them along with your request for a trial to sales@kaseco.com.

S&P 500 Index (SPX)

By Dean Rogers

The slowing Chinese economy, lackluster manufacturing data, and a weaker yuan have sent Chinese stocks tumbling in the first week of 2016. China’s stock market has been halted twice this week when volatility limits were reached and is down seven percent over the last few days. The selloff has spilled over into global markets as the Dow Jones Industrial Average and S&P 500 Index are off to their worst starts for a year ever.

The S&P 500 Index (SPX) charts reflect the near-term negative tone. Several factors indicate the decline should challenge support levels below August’s 1867.01 low at 1842. This will be a crucial decision point for a much more bearish outlook and sustained decline over the next several weeks and possibly months.

The table below shows SPX targets and resistance levels and the associated probabilities for meeting those targets and levels within the next 10 trading days. Kase’s technical forecasting models indicate odds are 80 percent for at least 1900 and 65 percent for 1842. The latter is the bearish decision point and will probably hold, at least initially.

SPX-Table

January 7’s close below the 62 percent retracement of the move up from 1867.01 to 2116.48 has shifted odds in favor of a continued decline. In addition, the 0.618 projection of the primary wave 2134.72 – 1867.01 – 2116.48 has been taken out by January 7’s close. Waves that close below the 0.618 projection generally extend to at least the 1.00 projection, in this case 1842 (+/- 7 points). Therefore, the SPX should fall to 1842 before a significant upward correction takes place. A close below 1842 would call for 1744 as the 1.382 projection for the wave down from 2134.72 with an intermediate confluence point at 1788.

SPX Daily with KaseXSPX-Daily

First resistance is 2006, the 38 percent retracement of the decline from 2116.48 to 1938.83. This level will most likely hold upon a correction. The key level for the near term is 2048, the 62 percent retracement. A close over 2048 would indicate the move down is most likely over and that the SPX will push towards at least 2093 which connects to 2184. A close over 2048 has 35 percent odds and a close over 2093 has 20 percent odds.

KaseX confirms the move down on the weekly chart. The recent overbought signal (gray arrow) and unfiltered short entries (pink triangles) indicate the decline should continue. On the daily chart, for those that are not already short, KaseX shows that it would be prudent to wait for a pullback and another confirmed sell signal (pink or purple triangle) after the recent short warning (yellow triangle).

SPX Weekly with KaseXSPX-Weekly

With all factors considered, the move down should continue and test the 1842 decision point in coming weeks. There is not enough technical evidence yet to definitively state that 1842 will hold. However, because of its importance, at a minimum, we expect at least a small upward correction to take place from 1842 once this target is met. Sustaining a close below 1842 would be extremely bearish for the long-term and could be the precursor to a bearish 2016.

This is a brief technical analysis of the S&P 500 Index based upon Kase’s technical forecasting models and trading indicator KaseX. If you are interested in taking a trial of KaseX please contact sales@kaseco.com. We would love to get your thoughts about the forecasted targets and probabilities. Leave a comment or send them along with your request for a trial to sales@kaseco.com.

By Dean Rogers

There is little doubt that the lack of demand for natural gas as a heating fuel this winter is taking its toll on prices. The market still looks and feels desperate to push higher, but fundamental and technical factors are working against this scenario. There is an outside chance prices could rally by another 10 to 15 cents on a close over $2.39, but we do not expect the move up to last much longer without a significant boost from external factors. In other words, it is going to have to get really cold, really soon, in key areas of the U.S., and last for several consecutive weeks for the move up to continue to any significant degree.

The move up from fresh 16 year lows stalled at $2.39 on December 29 and has subsequently oscillated in a narrowing range. A coil, or possibly an ascending triangle, has formed, and prices briefly broke lower out of the formation before Wednesday’s settlement. The formation indicates a breakout should take place very soon as the pattern nears its apex. The key levels to watch are $2.26 and $2.39.

NGG6 20160106

Odds favor a break lower due to KaseX’s bearish turn signal (purple arrow) on the 3.5-cent Kase Bar chart. A close below $2.26 would call for $2.17 and $2.09.

As stated, there is a modest chance that prices could rally 10-15 cents on a close over $2.39. However, even if this is the case, we do not expect prices to overcome $2.55 given current circumstances.

This is a brief natural gas forecast for the next day or so. Our weekly Natural Gas Commentary is a much more detailed and thorough analysis. If you are interested in learning more, please sign up for a complimentary four-week trial.

Walt Disney Co. (DIS)

By Dean Rogers

“Well, the Force is what gives a Jedi his power. It’s an energy field created by all living things. It surrounds us and penetrates us; it binds the galaxy together.” You may think that I am referring to the legendary words spoken by Obi-Wan Kenobi to Luke Skywalker while teaching him the ways of the Jedi in “Star Wars” (later retitled “Star Wars Episode IV: A New Hope”). However, I refer to that quote because Walt Disney Co. has made the essence of Obi-Wan Kenobi’s statement about the Force the mantra of their capitalization on the Star Wars brand after acquiring Lucasfilm in 2012 for $4.06 billion.

For the past several months, and likely for the next several years, everywhere you look Star Wars branded items from toys, to clothing, to cars, and even makeup, surround us, penetrate us, and binds Disney’s marketing efforts together. I call it the “Essence of the Force Strategy”.

So far, Walt Disney Co.’s strategy has worked, and it has worked well. “Star Wars Episode VII: The Force Awakens” has already shattered world-wide box office records and has brought in over $1 billion since its opening in the U.S., and some think that it will bring in $1-2 billion more after its opening in China on January 9. Those figures will not even scratch the surface of what is to come from the Star Wars brand for Walt Disney Co. in merchandise sales, Episodes VIII and IX, and the expansion movies like “Star Wars: Rogue One” slated for release in December 2016. The key question is, will Star Wars be enough of a boon to support DIS and turn the stock price higher in coming weeks, months, and even years?

There is a lot more to Walt Disney Co. than Star Wars. They have made brilliant moves in recent years with their acquisition of Lucasfilm, Marvel Studios, Pixar, and The Muppets to name a few. However, there are other areas of Walt Disney Co., such as the rising sports right costs of ESPN, that weigh heavy in the minds of some Wall Street pundits. Enough so, that some are doubting the prospects of a long-term move higher for DIS shares.

DIS’s December decline, from a technical standpoint, is most likely a correction of the longer-term move up, and the breaking point is $101.3. Our price forecasting model, based on various components of technical analysis, shows that the long-term outlook for DIS is positive, but that the downward correction could extend in coming weeks before DIS overcomes key resistance at $114.5.

The following table shows the near-term targets and support levels along with probabilities of meeting those targets and levels within the next 10 trading days. This is a short-term forecast, but the implications of targets and levels discussed could have a long-term impact on the share price of DIS.

DIS-Table

On Monday, December 28, KaseX confirmed a bullish turn signal (green arrow) and a first buy signal (yellow triangle). The combination of these two signals is called a pierced dart, and is usually a strong buy. The pierced dart puts short term odds in favor of a move to at least $108.5. This then connects to $110.5 and $114.5. A close over $114.5, which is near the 62 percent retracement of the decline from $120.65 to $104.3 and the $114.75 swing high, would indicate the long-term bullish move is going to continue.

20151229 DIS

However, the wave formations down from $120.65 and $114.75 indicate a deeper test of support might take place first. This hinges on a close below $105.6, which is near the 62 percent retracement of the move up from $104.3. A close below $105.6 would shift near-term odds in favor of a deeper test of support with $103.8 and $101.3 as the next thresholds.

The reason that $101.3 is the breaking point for DIS is that it is the 62 percent retracement of the move up from $90.0 to $120.65, the 1.00 projection for the wave $120.65 – 107.62 – 114.75, and the 0.618 projection for the wave $122.08 – 90.0 – 120.65. A close below $101.3 would not only call for the decline to extend to $96.4 and $93.7, the 1.382 and 1.618 projections of the wave down from $120.65, but possibly $88.6, the 1.00 projection of the wave down from $122.08.

The confluence at $101.3 indicates that DIS shares will be hard pressed to close below this level. We do not expect $101.3 to be broken, and as long as this level holds, it means Walt Disney Co.’s “Essence of the Force Strategy” is working and there may be a good buying opportunity on a move back up from $101.3 if prices slide this low.

This is a brief technical analysis of DIS based upon Kase’s technical forecasting models and trading indicator KaseX. If you are interested in taking a trial of KaseX please contact sales@kaseco.com. We would love to get your thoughts about the forecasted targets and probabilities. Leave a comment or send them along with your request for a trial to sales@kaseco.com.

By Dean Rogers

Natural gas is finally showing some signs of life as 2015 comes to a close. Reports that colder than normal temperatures along the East Coast and in the Great Lakes region for the first week of January have sparked a much needed relief rally from recent 16-year lows.

February natural gas, which will become the prompt futures contract on January 30, rallied to $2.061 on Wednesday and settled at $2.036. This was above the December 14 gap down from $2.022. Confluent technical resistance was met at $2.061, a crucial wave projection that connects to $2.13, $2.22, and $2.27. The wave $1.802 – 2.011 – 1.933 that met its 0.618 projection at $2.061, the close over the $2.022 gap, the break higher out of an intraday bullish descending triangle, and KaseX’s pierced dart signal (green arrow, bullish divergence, and yellow triangle, first buy signal) indicate the move up should extend to at least $2.08 and very likely $2.13 over the next few trading days.

NGG6 20151223

There is little doubt that the move up is corrective of the longer-term decline, and it is too soon to definitively state that a long-term bottom has been made. Tomorrow’s EIA Weekly Natural Gas Storage Report could make or break the rally in the short-run. Lighter trade volume around the holidays is also a concern that could lead to the rally being short-lived. However, if temperatures do turn colder than normal in key areas of the U.S. as anticipated in coming weeks, bullish sentiment alone could support prices above $1.90 for the interim.

Wednesday’s $2.00 midpoint is first support, and will likely be tested on Thursday. If the move up is going to continue it should hold $1.96 and has to hold $1.90. The $1.96 threshold is near Wednesday’s open and the 38 percent retracement of the move up from $1.802 to $2.061. A move below $1.96 would not only call for the $1.933 swing lows to be taken out, but more importantly for a test of the 62 percent retracement at $1.90. A close below $1.90 would indicate the rally is over and that another test of recent lows is right around the corner.

This is a brief natural gas forecast for the next day or so. Our weekly Natural Gas Commentary is a much more detailed and thorough analysis. If you are interested in learning more, please sign up for a complimentary four-week trial.

Apple Inc. (AAPL)

Apple’s stock has taken a bit of a beating this year, and the holiday season has not been the boon loyal shareholders had hoped for. Most technical factors are negative and odds favor a continued decline. However, there are a few positive technical factors that indicate the upward correction that began on November 21 could extend first.

Overall, the outlook is for AAPL is negative and our technical price forecasting model indicates that over the next ten days there is a 70 percent chance for $106.4 and a 60 percent chance for $103.8.

AAPL - Table

The decline from $123.82 is forming a five-wave trending pattern, and $102.5 is the key support target for the formation. Wave III is currently in progress and $102.5 is a potential stalling point and beginning of Wave IV. Should prices settle below $102.5 look for Wave IV to form from $98.8.

There is some technical evidence that indicates AAPL could rise to $108.9 and even $111.0 before the first target at $106.4 is met. The decline stalled at $105.57 on Monday, formed a pseudo hammer, and has been flirting with Friday’s $107.5 midpoint. In addition, KaseX, shown in the chart below, confirmed a weak bullish turn threat (gray arrow). The signal indicates stops on the daily chart could be tightened to approximately $112.3, which is in line with our $112.6 resistance threshold.

AAPL

If the upward correction is going to extend in a significant manner it will need to close over at least $108.9 and very likely $111.0. The latter is strong near-term resistance that we expect to hold. A close over $111.0 would open the way for and extended upward correction to $112.6 and even $114.4.

Under Armour Inc (UA)

Since September UA’s stock performance has been dismal relative to that of their largest competitor, Nike (NKE), whose earnings hit the street Tuesday afternoon. NKE is pegged as one of the strongest performing stocks in the Dow Jones Industrial average, up 35 percent so far. The outlook for NKE, at least from a technical standpoint, is bullish. Conversely, we expect UA’s share price to continue to decline.

Most technical factors for UA are negative and odds are 75 percent for at least $78.1. This then connects to key support at $76.1. Longer-term odds favor $72.5 and $70.5, but we expect a correction to take place before the lower targets are met.

UA - Table

Kase StatWare, shown in the chart below, reflects the bearish sentiment with first class short KEES permissions (pink dots) on the daily bars for the past few days. That said, momentum on the KaseCD and KasePO are setup for divergence and the KasePO is nearing oversold territory. This means that a correction might take place soon.

UA

The one solid positive technical factor was November 22’s hammer. This is a reversal pattern that also indicates a correction might take place before UA falls below $78.1 again. The correction should hold $81.9, but $84.6 is the key threshold. A close over this would open the way for an extended upward correction before the decline ultimately continues.

These are brief technical analyses based upon Kase’s technical forecasting models and trading indicators KaseX and Kase StatWare. If you are interested in taking a trial of KaseX or Kase StatWare please contact sales@kaseco.com. We would love to get your thoughts about the forecasted targets and probabilities. Leave a comment or send them along with your request for a trial to sales@kaseco.com.

By Dean Rogers

Natural gas is still looking for support from weather, but until cold temperatures arrive in key areas of the U.S. prices should continue to grind lower. The negative bias is confirmed by KaseX’s filtered short signal (purple diamonds).

Natural Gas

January futures met an important target at $2.15 on Wednesday. This was the 0.618 projection for the wave $2.347 – 2.175 – 2.259. A close below $2.15 would call for key support at $2.10, the 1.00 projection.

The importance of $2.15 indicates a correction might take place first, but look for resistance at $2.22 to hold. A close over $2.22 would call for $2.26 and possibly $2.30. A move higher than $2.30 is doubtful without support from weather.

This is a brief natural gas forecast for the next day or so. Our weekly Natural Gas Commentary is a much more detailed and thorough analysis. If you are interested in learning more, please sign up for a complimentary four week trial.

By Dean Rogers

January WTI futures met crucial support at $40.41 early Monday. This was the 1.00 projection for the wave $52.02 – 43.52 – 49.23. The subsequent move up was initially promising for bulls, but stalled at $42.75 before it could overcome $43.2 resistance.

CLF6 20151123-DIt is a tight call tomorrow, but we expect a test of $40.9 before the move up continues. This is confirmed on the intraday charts by the latest KaseX weak short signal (pink triangle). Support at $40.9 is near the 0.618 projection of the wave $42.75 – 41.09 – 42.62 and the $41.09 swing low. A close below $40.9 would call for $40.0 and possibly lower.

CLF6 20151123

Conversely, not all hope is lost for the upward correction to extend. The daily chart’s Kase Easy Entry System (KEES) permissions shifted from first class short (pink dots) to second class long (light blue dot). Therefore, there is still a reasonable chance for a close over $43.2 and an upward correction to $43.8, the 38 percent retracement from $49.23 to $40.41. A close over $43.8 would significantly increase the probability for an extended move to test major resistance levels.

This is a brief analysis and outlook for the next day or so. Our weekly Crude Oil forecast is a much more detailed and thorough energy price forecast. If you are interested, please sign up for a complimentary four week trial.

By Dean Rogers

As we stated last week, the natural gas call is extremely tight right now. The market can only tell us what it knows about itself, and right now the market is not sure what it knows.

The move up from $2.188 stalled at $2.398 on November 6, and since then prices have worked their way lower in an extremely choppy manner to test major support at $2.25. This level held on today’s close, so technically prices are still trading within the range.

The market is waiting on cold weather to push it higher, but today’s price action did not help short-term bulls. It will eventually get cold and prices will rise, but today’s decline to $2.25 puts odds slightly in favor (around 60 percent) of a decline to test least $2.20 and possibly $2.12 over the next few days.

NGZ5 20151111

That said, $2.25 is an extremely important and highly confluent wave projection and retracement that has been tested a few times and has held on a closing basis since the move up from $2.188 began on October 30. Therefore, caution is warranted, and given the circumstances, we would not be at all surprised to see $2.25 continue to hold.

From a trading strategy standpoint, this is a time that we would normally recommend sitting on the sidelines for a bit while waiting for a more concise direction and break out of the $2.25 to $2.37 range. Upon a close below $2.25 or above $2.37, a trade may be taken upon a confirming long or short signal from indicators like Kase StatWare or KaseX. Shorter bar lengths are also recommended because they will help limit risk and should be used to pinpoint entries and exits and determine stop levels until there is a close either below $2.12 or above $2.48. At that point a clear long-term trend will have been established and trades may then be scaled to longer bar lengths with wider stops.

This is a brief natural gas forecast ahead of tomorrow’s EIA report. Our weekly Natural Gas Commentary is a much more detailed and thorough analysis. If you are interested in learning more, please sign up for a complimentary four week trial.

By Dean Rogers

Natural gas cautiously rose to $2.317 to fulfill the smaller than (0.618) projection for the wave $2.188 – 2.336 – 2.231. Typically, a move to $2.38 would now be expected because waves that meet the 0.618 projection normally extend to at least the equal to (1.00) projection. The pullback to $2.255 is a bit worrisome, but until the $2.231 swing low is taken out odds favor of a move to $2.38. This is a crucial target because $2.38 is the 38 percent retracement from $2.78 to $2.188 and makes a connection to $2.48 where last week’s gap would be filled.

NGZ5 20151104

KaseX warned that the decline from $2.317 would extend (yellow triangle), and as stated, support at $2.25 is already being challenged. A move below $2.231 would take out the wave up from $2.188 and its projections to $2.38 and higher. This would in turn shift odds back in favor of a decline to $2.11 to fulfill the requirements of the textbook five wave pattern down from $3.391 as discussed last week.

This is a brief natural gas forecast ahead of tomorrow’s EIA report. Our weekly Natural Gas Commentary is a much more detailed and thorough analysis. If you are interested in learning more, please sign up for a complimentary four week trial.