Short-Term Energy Forecasts – January 17, 2018

WTI Crude Oil Forecast

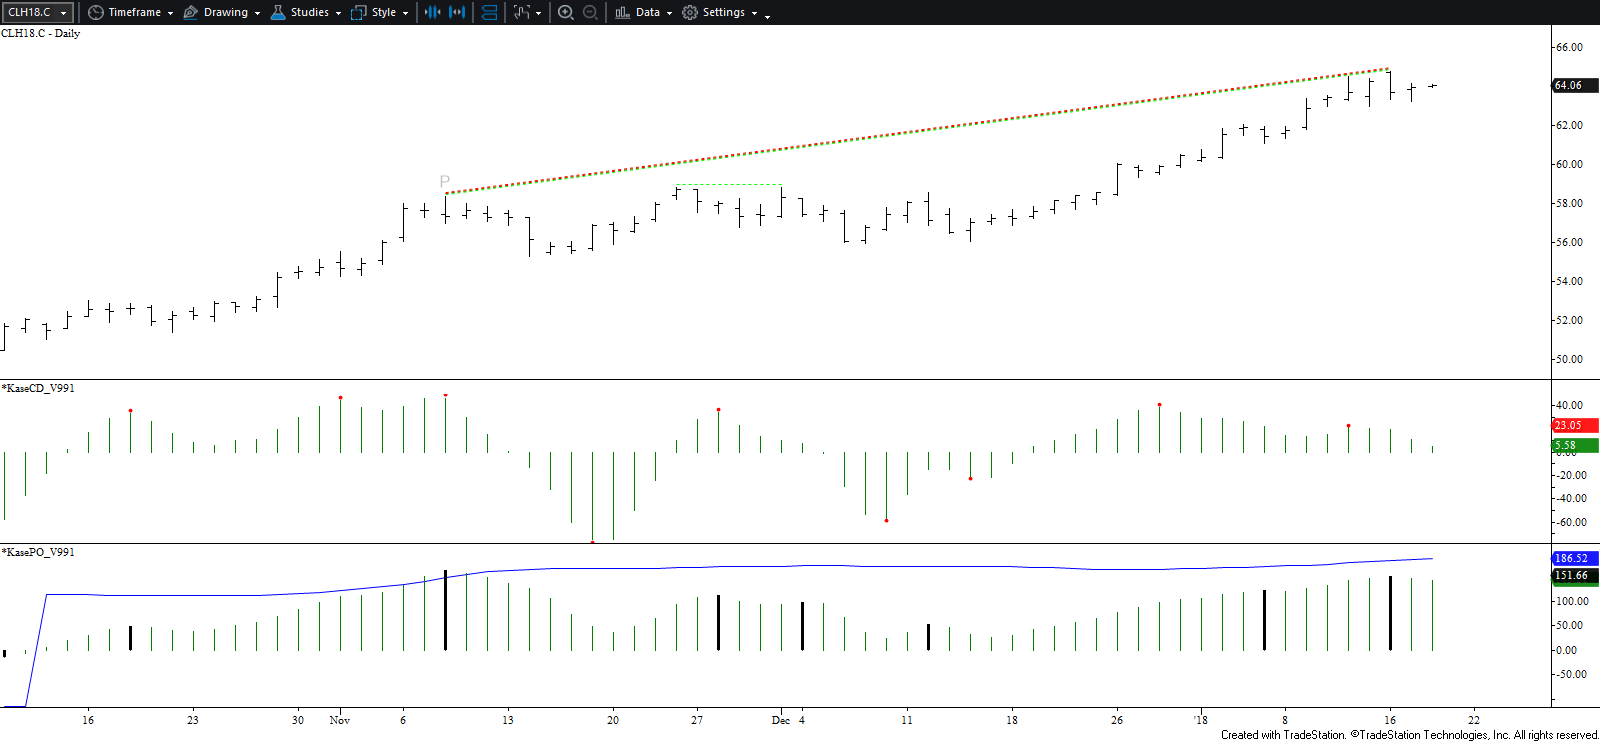
March WTI crude oil confirmed bearish daily KasePO and KaseCD weak divergences. A weak divergence is one that forms when the confirming bar closes in the opposite direction of the signal, in this case, up. Weak divergences generally do not follow through as well as normal divergences but do warrant caution. In addition, yesterday’s midpoint held, leaving the daily dark cloud cover reversal pattern intact.

Tomorrow odds favor a continued decline to at least $63.2. This is the smaller than (0.618) target of the wave $64.83 – 63.25 – 64.14 and connects to $62.5 as the equal to (1.00) target. Settling below $62.5 would open the way for a larger pullback to $62.0 and even $61.6, the intermediate (1.382) and larger than (1.618) targets for the wave down from $64.83.
WTI Crude Oil Daily Chart

Should prices rise a bit higher first, look for $64.4 resistance to hold. A move above this would call for a new high of $65.1, a highly confluent and key threshold that connects to $66.3 and higher.

Natural Gas Forecast

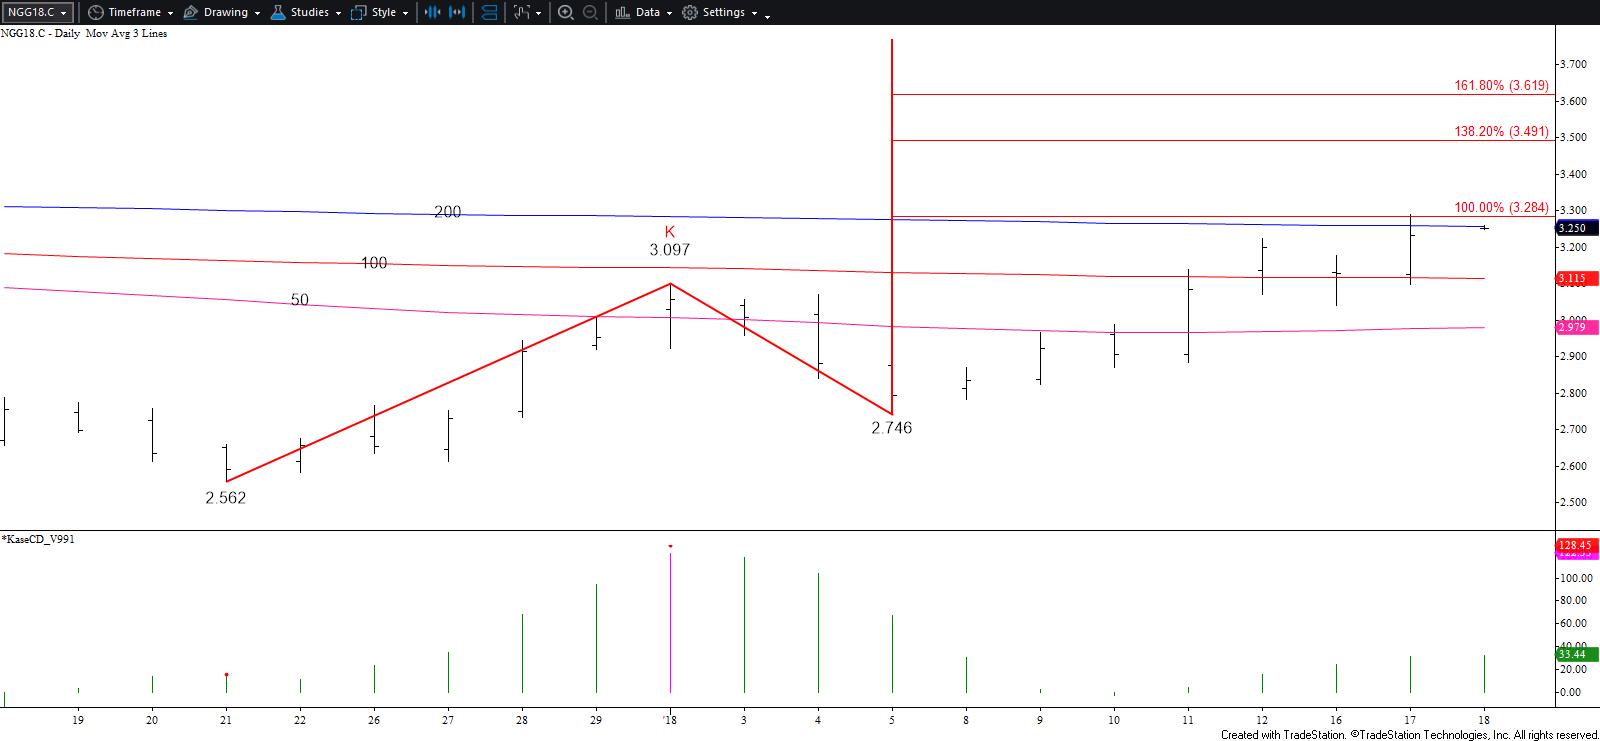
February natural gas a crucial target at $3.29 when it rose to $3.288 today. This is an extremely important area for natural gas because $3.29 is in line with the equal to (1.00) projection of the wave $2.562 – 3.097 – 2.746, the 62 percent retracement of the decline from $3.772, and the 200-day moving average. A sustained close above $3.29 would confirm the market’s bullish sentiment, opening the way for a larger scale move up to $3.49 and possibly higher over the next few weeks.

That said, given the importance of $3.29 caution is warranted. This is a potential area in which the move up could stall and another sizable correction take place. In addition, the KaseCD, MACD, and Slow Stochastic are set up for bearish daily divergence.
Natural Gas Daily Chart

If prices are going to overcome $3.29 this week $3.18 should hold. Key support for the next few days is $3.13, today’s open and the 62 percent retracement of the move up from $3.039. A close below this would not doom the move up but would open the way for a more substantial correction to challenge support at $3.08 and even $3.01.

This is a brief analysis for the next day or so. Our weekly Crude Oil and Natural Gas Commentaries and daily updates are much more detailed and thorough energy price forecasts that cover key futures contracts, calendar spreads, and ETFs. If you are interested in learning more, please sign up for a complimentary four-week trial.


November WTI crude oil met the 62 percent retracement of November’s decline from the 2017 $58.37 swing high to $42.8 at $52.42 when it rose to $52.43 early this morning. This is major resistance because it is also a confluent wave projection. Settling above $52.6, the upper end of the confluence range around $52.42, would be bullish for the long-term.

Crude Oil Daily Candlesticks

For now, the long-term outlook remains positive. However, normally, when such an important target is met a significant correction will take place before that objective is overcome on a sustained closing basis. Today’s pullback from $52.42 formed a bearish Harami line and star, which is a reversal pattern. These patterns are not highly reliable, but the overbought daily Stochastic, RSI and nearly overbought KasePO indicate a pullback should take place soon.

This afternoon’s move up after the API Petroleum Inventories report was released indicates $52.6 might be tested early tomorrow. However, we expect this level to hold and for the downward correction to extend to at least $51.4 tomorrow, which is in line with Monday’s $51.45 midpoint. A close below this would open the way for $51.0 and possibly lower.

At this point, even a normal correction of the move up from the $46.14 swing low could drop prices to $50.0 should the corrective pullback extend as expected.

This is a brief analysis for the next day or so. Our weekly Crude Oil Commentary and daily updates are much more detailed and thorough energy price forecasts that cover WTI, Brent, RBOB Gasoline, Diesel, and spreads. If you are interested in learning more, please sign up for a complimentary four-week trial.

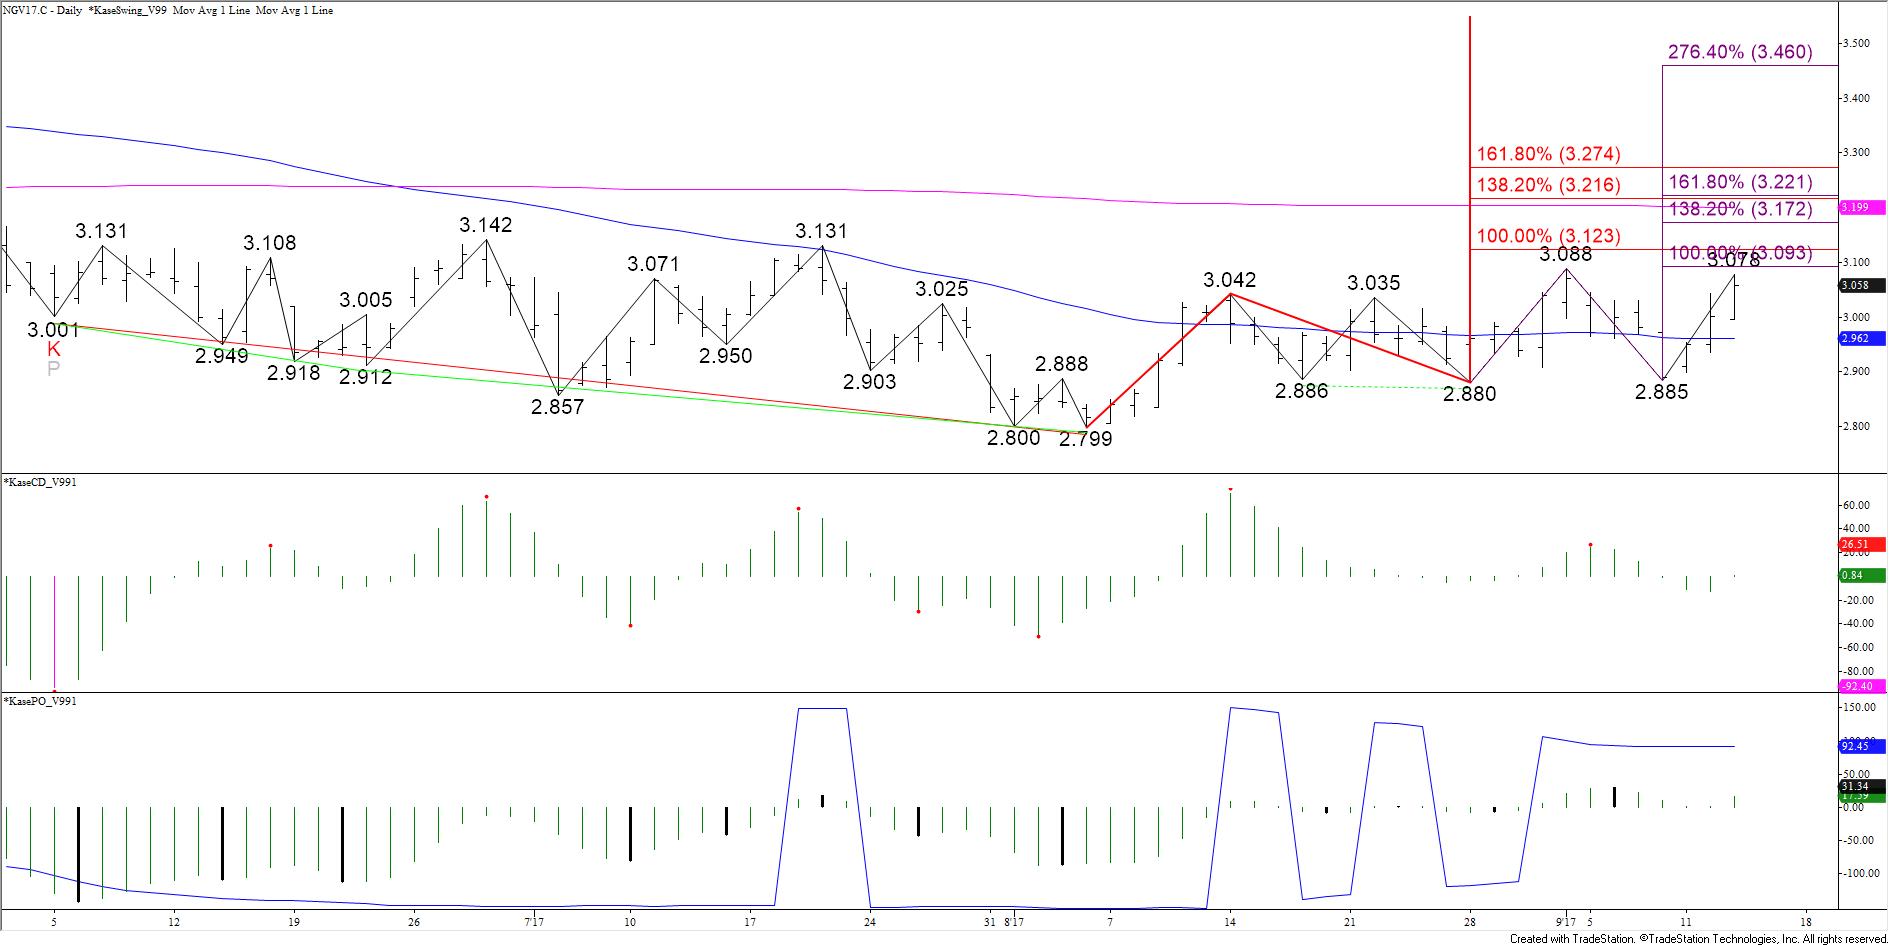
October natural gas settled above $3.03 and fulfilled the $3.06 target. The next objective is $3.09, the equal to (1.00) target of the wave $2.88 – 3.088 – 2.885. The key objective is $3.12, the smaller than (0.618) target of the wave $2.799 – 3.042 – 2.88. This has been strong resistance all summer for October and the continuation chart, making it a decision point for a larger scale move up and sustained recovery.

Natural Gas Daily Chart

A sustained close above $3.12 would open the way for $3.17 and $3.22. Above $3.12 the $3.22 objective is most important because it is the 50 percent retracement of the decline from $3.619. This is also a confluent projection for the aforementioned waves up from $2.799 and $2.88.

Daily momentum does not show any signs that the move up will stall. However, a few intraday charts are setup for divergence or are overbought. Therefore, given $3.12 has been such strong resistance a pullback might take place before it is overcome.

At this point, any move down will most likely be corrective. Tomorrow, support at $3.03 should hold. Key support is $2.96, which is the 50-day moving average and 62 percent retracement of the move up from $2.88 so far.

This is a brief analysis for the next day or so. Our weekly Natural Gas Commentary and daily updates are much more detailed and thorough energy price forecasts that cover key natural gas futures contracts, calendar spreads, the UNG ETF, and several electricity contracts. If you are interested in learning more, please sign up for a complimentary four-week trial.

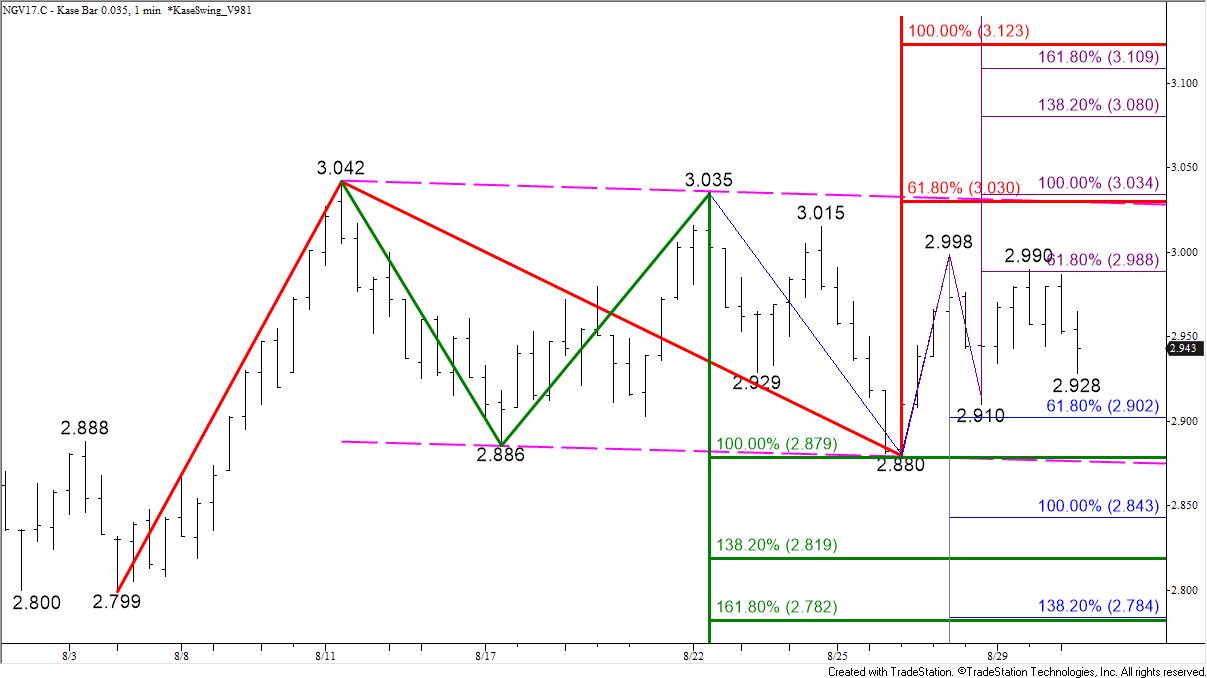
October natural gas looks to be well balanced as it continues to oscillate in a range between nominally $2.88 and $3.03. The range forms a bullish flag after holding support at $2.88 on Monday. However, today’s early move up stalled before it could overcome the $2.998 swing high and challenge the flag’s $3.03 upper trend line.

Flags are generally reliable continuation patterns. However, in this case, we believe there is a high probability that $3.03 will hold and that ultimately prices will break lower out of the pattern. This is because the pattern has been very wide relative to the prior move up from $2.799 to $3.042. In addition, prices have not been able to overcome the psychologically important $3.00 level for the past few days.

NGV17 Kase Bar Chart
NGV17 $0.035 Kase Bar Chart

Because the wave $2.88 – 2.998 – 2.91 met its $2.99 smaller than (0.618) projection there is still a reasonable chance for a test of $3.03. However, a move below the $2.91 swing low would wipe out that wave and significantly dampen the odds for $3.03 and higher. Therefore, at this point, a move above either $2.99 or below $2.91 should give us a good idea of the direction for the next few days.

The market remains tight and may continue to oscillate in a narrowing range, but with all factors considered, tomorrow look for a test of $2.90 and possibly $2.87. A close below $2.87 would confirm a break lower out of the flag, opening the way for $2.84 and lower.

Should the $2.91 swing low hold and prices overcome $2.99, near-term odds will shift back in favor of challenging $3.03. A close above $3.03 would confirm a break higher out of the flag and call for $3.08 and ultimately $3.12.

This is a brief analysis for the next day or so. Our weekly Natural Gas Commentary and daily updates are much more detailed and thorough energy price forecasts that cover key natural gas futures contracts, calendar spreads, the UNG ETF, and several electricity contracts. If you are interested in learning more, please sign up for a complimentary four-week trial.
WTI crude oil fell sharply last Thursday after OPEC and other major producers announced an extension to production cuts through March 2018. This was expected by most, and according to media, the decline was due to disappointment that production cuts were not deeper, which many had hoped for.

U.S. shale production remains a concern, though stockpiles fell for a seventh straight week, a fact that many have seemed to overlook. In addition, some are reportedly wondering what OPEC’s plan for an exit strategy to the production cuts will be without flooding the market with supply again.

For now, the extension of the OPEC cuts has become a game of “wait-and-see”. They will undoubtedly have a longer-term impact on prices, but at this point, it is hard to tell how significant the impact will be.

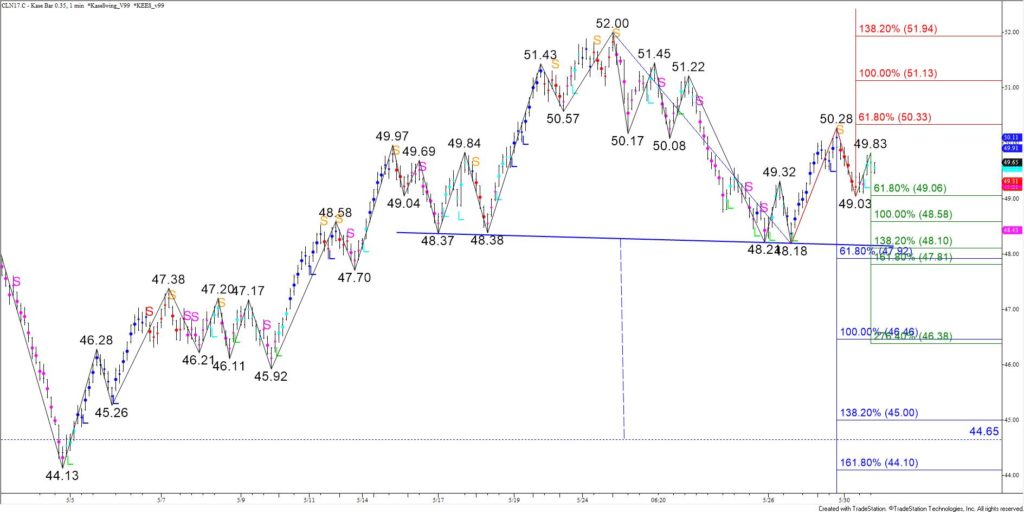
Most technical factors are negative, though it is still a tight call. July WTI made up some ground since falling late last week. However, the formation of a head and shoulders pattern is negative for the near-term outlook. The pattern’s neckline is $48.1, a close below which would open the way for the move down to continue toward its $44.65 target.

July 2017 WTI Crude Oil - 35-Cent Kase Bar Chart
July 2017 WTI Crude Oil – 35-Cent Kase Bar Chart

The connection to $48.1 is made through $49.1 and $48.6, the 0.618 and 1.00 projections of the wave $50.28 – 49.03 – 49.83. Tomorrow, we expect prices to test $49.1 and $48.6. A close below the lower objective would call for $48.1, the 1.382 projection, which is also near the 0.618 projection of the larger wave, $52.0 – 48.18 – 50.28.

That said, should prices rise above $50.3, near-term odds would shift in favor of $51.1 and possibly higher. The $50.3 level is the top of the head and shoulder’s right shoulder and the 0.618 projection of the wave $48.18 – 50.28 – 49.03. The 1.00 projection is $51.1. Therefore, a close above $50.3 would significantly damage the head and shoulders formation and the likelihood of a break below its $48.1 neckline.

This is a brief analysis and outlook for the next day or so. Our weekly Crude Oil Commentary and daily updates are much more detailed and thorough energy price forecasts that cover WTI, Brent, RBOB Gasoline, Diesel, and spreads. If you are interested in learning more, please sign up for a complimentary four-week trial.
WTI crude oil continues to rise ahead of May 25’s OPEC meeting. Market participants are optimistic that OPEC will extend production cuts through the end of 2017. Many hope this will help to ease the global supply glut. U.S. production remains a concern, but for now, oil prices are poised to rise.

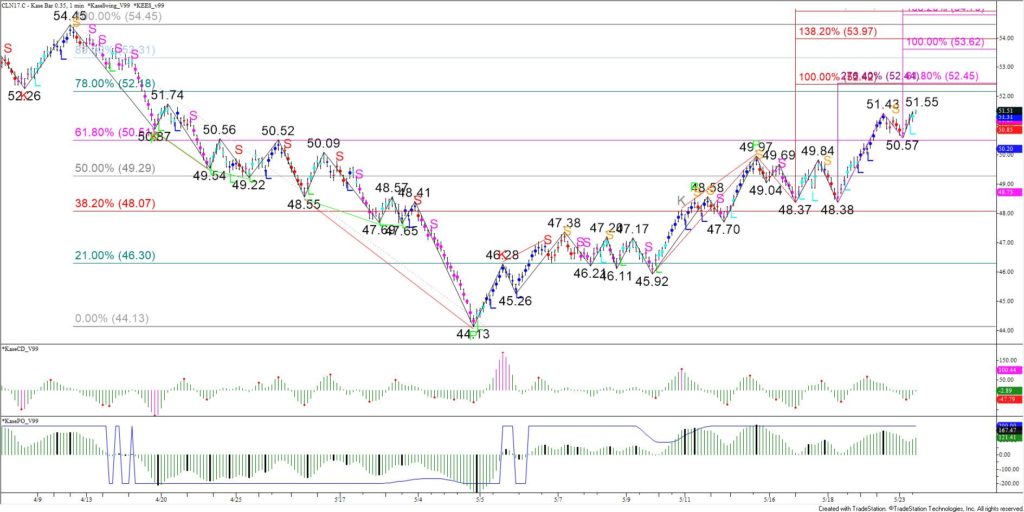
Most technical factors are positive. In recent days, July WTI sustained settles above the 62 percent retracement of the decline from $54.45 to $44.13. This is a strong indication that the recovery from $44.13 will continue.

July 2017 WTI Crude Oil - 35-Cent Kase Bar Chart
July 2017 WTI – 35-Cent Kase Bar Chart

Today’s break higher out of another intraday bullish flag and settle above Monday’s $51.43 high opens the way for $52.5. As shown in the chart above, this is a highly confluent wave projection that sits just above the 78 percent retracement of the decline from $54.45 to $44.13. The confluence of wave projections at $52.5 make it a potential stalling point.

Momentum on the KaseCD and KasePO is rising. The KasePO is setup for bearish momentum divergence, a reversal signal that forms when higher swing highs in price and lower swing highs in momentum are made. To confirm the divergence signal, a swing high in price and momentum must form before momentum rises to a new high.

The Kase Easy Entry System (KEES) also triggered a second class buy signal (light blue L) on the 35-cent Kase Bar chart today. A second-class buy signal indicates the majority of momentum indicators KEES examines are positive but that momentum on the synthetic longer bar length is negative. Traders using Kase StatWare may have taken a smaller position and placed a tighter trailing stop. Stops may be widened once the KEES permissions shift to first class (dark blue dots).

For the near-term, the $50.57 swing low is important support. A move below this would likely trigger the bearish KasePO divergence and open the way for a correction to $50.0 and possibly $49.6.

This is a brief analysis and outlook for the next day or so. Our weekly Crude Oil Commentary and daily updates are much more detailed and thorough energy price forecasts that cover WTI, Brent, RBOB Gasoline, Diesel, and spreads. If you are interested in learning more, please sign up for a complimentary four-week trial.
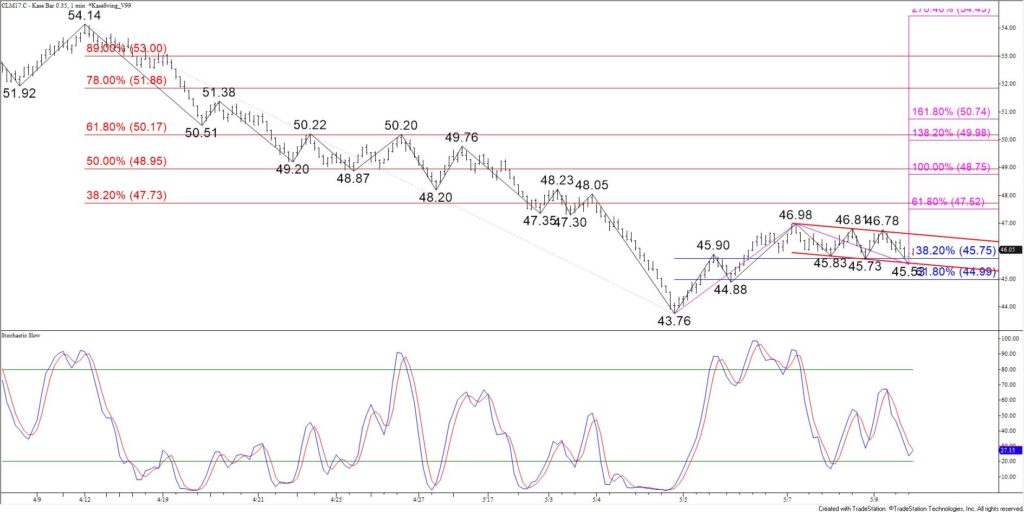
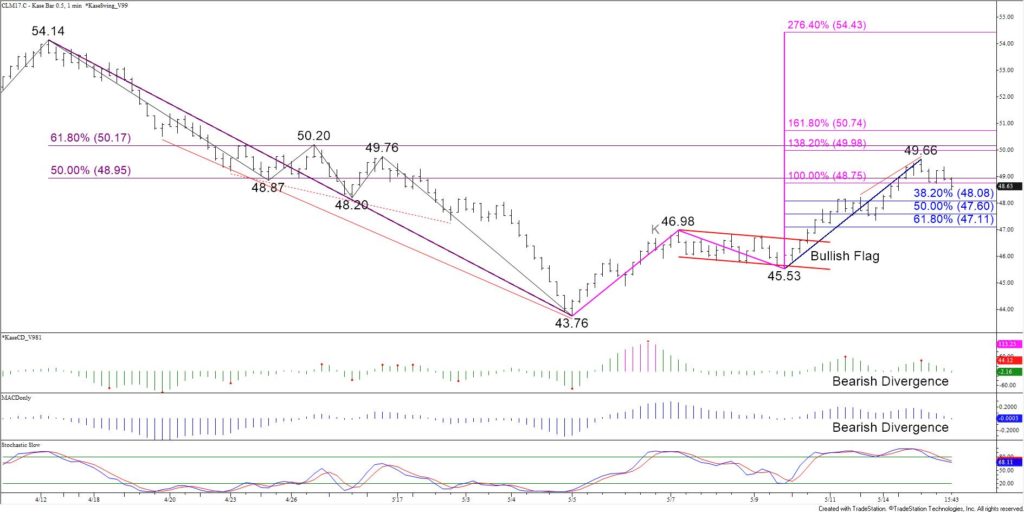
Last Wednesday, June WTI broke higher out of the intraday bullish flag discussed in the crude oil forecast. The subsequent move up overcame the 0.618 and 1.00 projections of the wave $43.76 – 46.98 – 45.53. However, June stalled at $49.66 before meeting key resistance at $50.1. This is the confluence point between the 1.382 projection and the 62 percent retracement of the decline from $54.14 to $43.76.

Ultimately, June WTI should challenge $50.1. A sustained close over this would be a strong indication the larger scale move down is over, for now. However, bearish KaseCD and MACD divergences on the $0.50 Kase Bar chart call for a test of support first.

June WTI Crude Oil - $0.50 Kase Bar Chart
June WTI Crude Oil – $0.50 Kase Bar Chart

So far, the decline from $49.66 has been reasonably shallow and choppy, indicating it is most likely corrective of the move up. Today, June settled below the 0.618 projection of the wave $49.66 – 48.73 – 49.38 and met the 1.00 projection at $48.5. Meeting the 1.00 projection means the correction may already be complete. However, until prices rise above the $49.38 swing high, odds favor a deeper correction to $48.1 and possibly $47.1.

If the move up is going to continue to $50.1 this week, $47.1 must hold. This is the 62 percent retracement of the move up from $45.53 to $49.66. A close below $47.1 would call for a deeper test of support and possibly for June to challenge the crucial $45.53 swing low.

This is a brief analysis and outlook for the next day or so. Our weekly Crude Oil Commentary and daily updates are much more detailed and thorough energy price forecasts that cover WTI, Brent, RBOB Gasoline, Diesel, and spreads. If you are interested in learning more, please sign up for a complimentary four-week trial.
The long-term outlook for WTI crude oil remains negative and it is too soon to state that a bottom has been made. However, last Friday, June WTI met major support at $43.76, the 1.00 projection of the wave $57.95 – 47.58 – 54.14 (exact projection was $43.77). This was also in the realm of the August 2016 swing low of $44.56 and the 62 percent retracement of the move up from $36.18 to $57.95 ($44.5). The confluence of support between $43.77 and $44.56 and the fact that this range has held on a closing basis favors a larger upward correction before the decline continues.

In addition to meeting support at $43.76, June WTI confirmed daily bullish divergences on the KaseCD and Stochastic and a bullish KasePO PeakOut (oversold signal). These signals call for the upward correction to extend. Most importantly, over the past two days, the pullback from $46.98 formed a bullish intraday flag, shown below on the $0.35 Kase Bar chart.

June 2017 WTI Crude Oil - $0.35 Kase Bar Chart
June 2017 WTI Crude Oil – $0.35 Kase Bar Chart

For now, according to Kase’s price forecasting model, odds are 65 percent for a break higher out of the flag. These odds will increase as prices rise toward the upper trendline of the flag at $46.6.

Important resistance at $47.6 should be challenged upon a break higher out of the flag. This is the confluence point between the 38 percent retracement of the decline from $54.14 to $43.76 and the 0.618 projection of the wave $43.76 – 46.98 – 45.53.

That said, there are some danger signs that indicate the flag, and other bullish technical factors, are on the teetering edge of failing.

The key to a break higher out of the flag and extended upward correction is holding support at $45.5. This is in line with the today’s $45.53 swing low and the flag’s lower trendline. A close below this would call for a test of $45.0, the 62 percent retracement of the move up from $43.76 to $46.98. Settling below $45.0 would shift near-term odds back in favor of testing the $43.76 low again.

This is a brief analysis and outlook for the next day or so. Our weekly Crude Oil Commentary and intra-week updates are much more detailed and thorough energy price forecasts that cover WTI, Brent, RBOB Gasoline, Diesel, and spreads. If you are interested in learning more, please sign up for a complimentary four-week trial.
Technical analysis is technical. This means there are mathematics, charts, and statistics involved. Some interested in studying and using technical analysis are dismayed when they encounter numbers and charts. A math, engineering, science, or financial degree is not required to make use of technical analysis. However, an orientation towards structuring a view of reality mathematically is helpful.

Some people think technical analysis is a way to quickly make a lot of money, become a hotshot trader, or a means to finding the “Holy Grail” of trading systems. Technical analysis is certainly a means to success, but there is no way to get around the need for commitment and perseverance. Success in using technical analysis, like any endeavor, will take hard work, commitment, and perseverance.

The Four Aspects of Technical Analysis

When using technical analysis there are four basic applications: instrument selection, timing trade entries and exits, managing risk, and forecasting.

Technical analysis can be used to select instruments to trade. For instance, if a trader wanted to scan the 1,000 most active stocks and pick the instrument most likely to take a sharp turn, they could use technical momentum indicators such as the MACD or RSI to look for divergence. Divergence is a momentum signal that is triggered when a trend is exhausted. If a divergence occurs, it is likely that the instrument is getting ready to turn in a statistically significant manner. The trader can then decide to further analyze and possibly trade that instrument.

Once a trader has selected an instrument they can use technical analysis to determine the instrument’s direction, strength and extent of potential trends, support and resistance levels, potential turning points, and risk.

Technical analysis is, as the name implies, a study or examination of the market. The analogy commonly used in technical forecasting is that it is similar to cartography or map drawing. In other words, you are drawing a map of how to get from point A to point B.

Once the map has been drawn and the forecast is complete a trader can use technical indicators, geometric formations, and other methods of analysis to determine entry and exit point for the market. This is called market timing, and is one of the greatest strengths of technical analysis.

Example of Using Technical Analysis

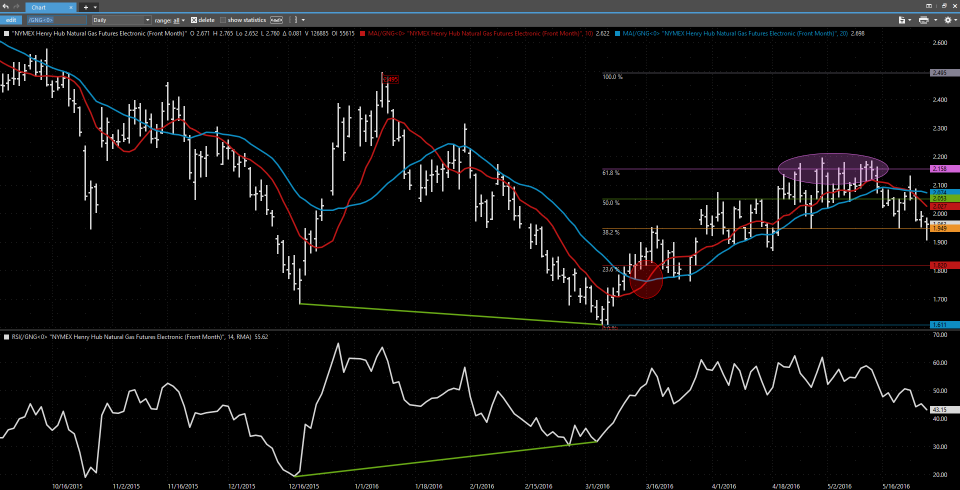
In the daily chart below as natural gas prices fell to new price swing lows the RSI momentum indicator was making higher lows. This was a clue that the decline was exhausted and that a significant turn higher was about to take place. A trader with a short position would possibly cover the positon once the divergence was confirmed (green trend lines).

NG Daily RSI Divergence

After covering the short trade, the trader could then time a long entry when the 10-period moving average (red line) crossed above the 20-period moving average (blue line). This crossover is shown within the red circle. When the fast moving average (10-period) rises above the slow moving average (20-period) it suggests the move up should continue because there has been an upward shift in momentum.

Once the long trade has been taken, the trader can then begin to identify resistance levels using other methods of technical analysis. In the example above, a series of Fibonacci retracements from the $2.495 swing high to the $1.611 swing low are shown to the right of the chart. The 38.2, 50, and 61.8 percent retracement levels of this move were identified as resistance well ahead of being met. Note that at each of these levels a small turn lower or trading range took place. Ultimately, the move up held near the 61.8 percent retracement (pink ellipse) and turned lower again.

Conclusion

Technical analysis is a means of analyzing and interpreting what the market knows about itself. As discussed, the tools within the practice of technical analysis are useful for instrument selection, timing trade entries and exits, managing risk, and forecasting. By learning and using technical analysis, one can become a better trader by gaining a deeper level of insight into the markets they trade.

sugarBy Cynthia Kase

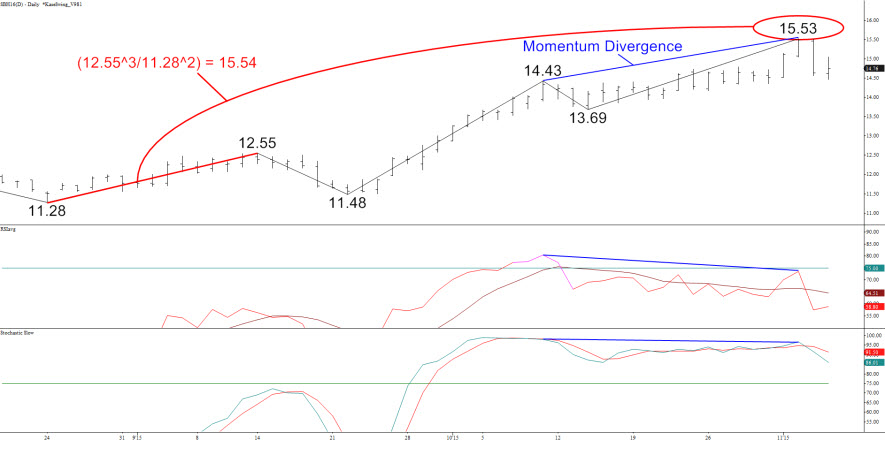
The market’s been watching the impact of El Niño since June. Then the National Oceanic and Atmospheric Administration said there was a 90 percent chance the baby would stick around all summer, and maybe even into 2016. Sugar has been rising since mid-August, as El Niño persisted, but turned choppy in October only to break to 15.53¢ as of the 3rd.

Apparently Niño’s wet weather is delaying the sugar harvest and fears have grown about undersupply. The technicals have been positive but slammed up against resistance at 15.53¢. So while it’s too soon to say if 15.53¢ is “it”, there is likely more downside.

15.53¢ is important for a few reasons. It failed by 5 points to reach the 21 percent retracement of the entire move down from 36.08¢ to 10.13¢ on the continuation chart. Second, the Stochastic and RSI momentum indicators were set up for bearish divergences at that price. Most important, 15.53¢ was a confluent target, as shown in the chart. That price is just 0.01 points shy of March’s “trend terminus” target (12.55^3/11.28^2) for the first wave up from 11.28¢.

SBH6_Fig1Charts created using TradeStation. ©TradeStation Technologies, Inc. 2001-2015. All rights reserved. No investment or trading advice, recommendation or opinions are being given or intended.

First support was met on Wednesday at 14.64¢. Next is 14.40¢, just 7 points below Thursday’s low. This is the 21 percent retracement for continuation’s entire move up, and a confluent retracement for the intermediate swings on both charts. It is also the 0.62 projection for the wave 15.53 – 14.47 – 15.05.

The key question is whether the decline, which only reached 15.47¢ versus 15.40¢ support, is over. The fact that the bounce up from 15.47¢ formed an ABC pattern where C is the 1.62 extension of A, exactly, and that prices then declined to 14.59¢, that is, below the prior 14.64¢ swing, means probably not.

14.40¢ remains to be broken, so a continued decline is not a sure thing, but 14¢, the major threshold, is likely.

The open and midpoints of candlesticks constitute support and resistance. Last week’s midpoint was 14.37¢ and the open for the week ending October 9, the last large up week prior, was 13.92¢. There’s also an important swing at 13.94¢. So as long as this holds (the lower end of a 14¢ +/- 0.1¢ range), odds are open for the bull market to resume.

Initial resistance is 15.40¢. The decline isn’t dead unless this is overcome. Above this, a highly confluent 15.95¢, the last remaining target (the Phi^3 corrective projection) for the first wave up, and occurs as a target 10 times for the 10 waves up from mid-October’s 13.69¢ swing low. The highest price to which the March chart projects which has a moderate probability is 18¢, the 0.62 projection of the entire move up.

Send questions to askkase@kaseco.com, and click the link learn more about Cynthia Kase’s latest video series, Kase on Technical Analysis.