Gold Technical Analysis and Near-Term Outlook
This is a brief analysis for the next day or so. Our weekly Metals Commentary and daily updates are much more detailed and thorough energy price forecasts that cover key COMEX precious metals futures contracts and LME Non-Ferrous (Base) metals, spot gold, the gold/silver ratio, and gold ETFs. If you are interested in learning more, please sign up for a complimentary four-week trial.
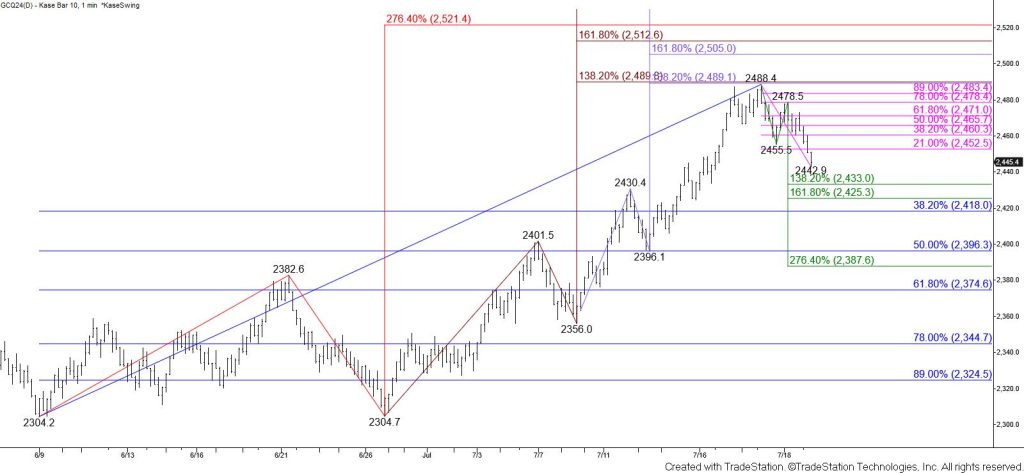
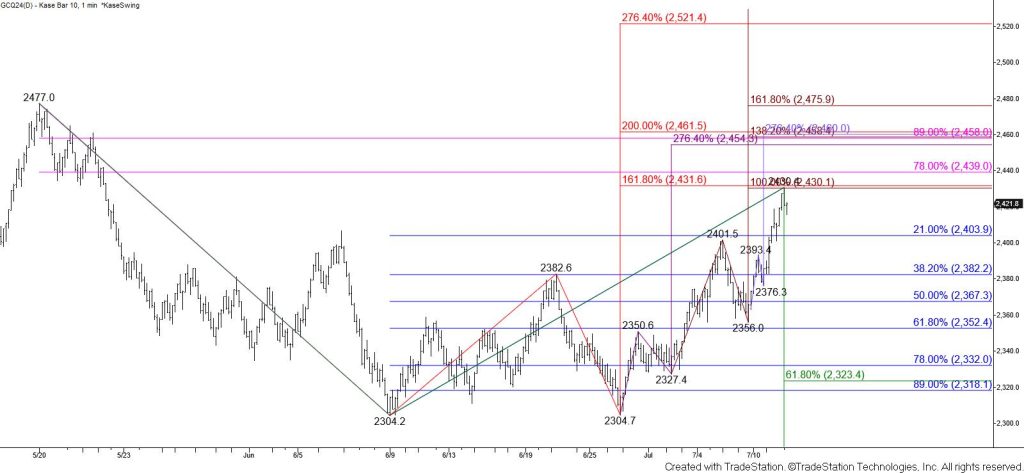
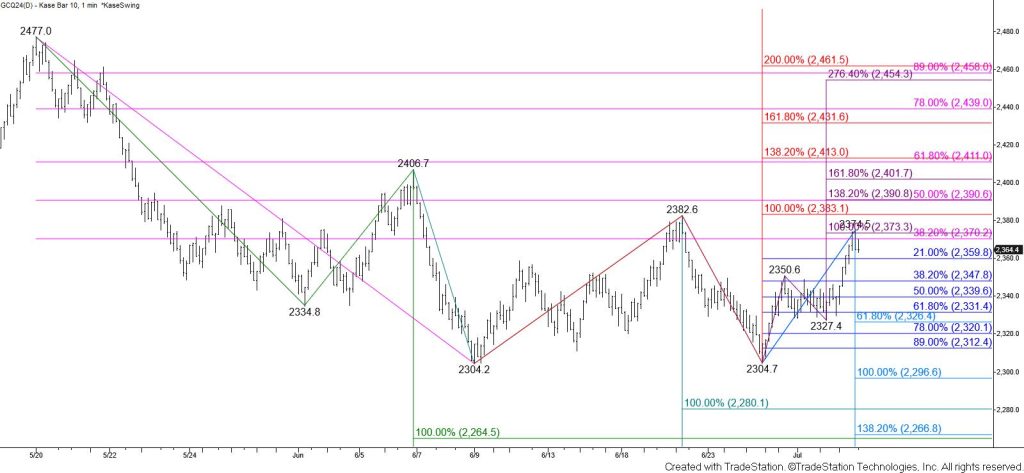
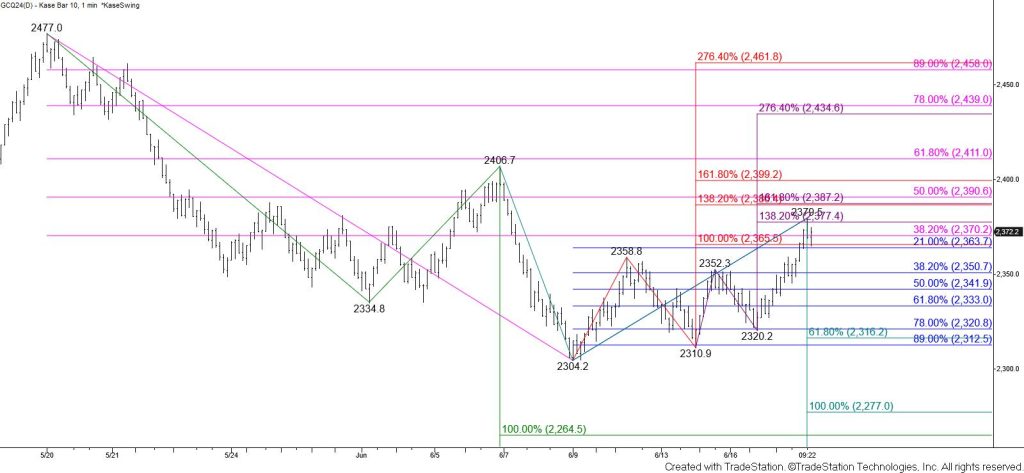
The longer-term outlook for gold is bullish after the August contract overcame the $2477 swing high. However, resistance at $2490 has held and the pullback from $2488 will likely test $2421 tomorrow. A normal correction of the move up from $2304.2 should hold $2421 because this is the larger than (1.618) target of the wave down from $2488.4 and the 38 percent retracement of the rise from $2304.2. Settling below $2421 would call for an extended test of support with objectives at $2392 and $2375.
Nevertheless, the trend remains bullish and the pullback from $2488.4 will likely prove to be a correction. Overcoming the $2478.5 swing high will invalidate the wave down from $2488.4 that projects to $2421 and $2392. This will also call for another attempt to overcome key near-term resistance at $2490.