Natural Gas Technical Analysis and Near-Term Outlook
This is a brief analysis for the next day or so. Our weekly Natural Gas Commentary and daily updates are much more detailed and thorough energy price forecasts that cover key natural gas futures contracts, calendar spreads, the UNG ETF, and several electricity contracts. If you are interested in learning more, please sign up for a complimentary four-week trial.
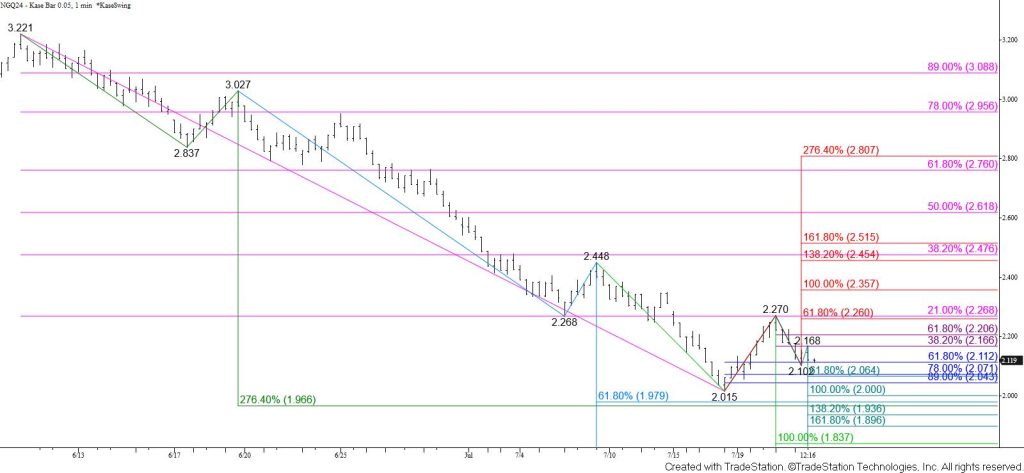
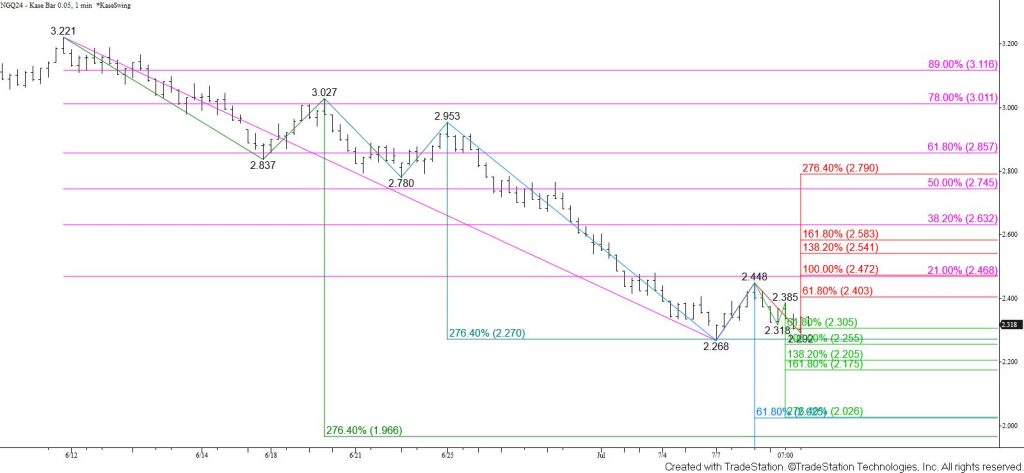
Natural gas rose to challenge the 21 percent retracement of the decline from $3.221 at $2.27 before stalling and pulling back for the past couple of days. The move down from $2.270 challenged but settled above the 62 percent retracement of the rise from $2.015 at $2.11 today.
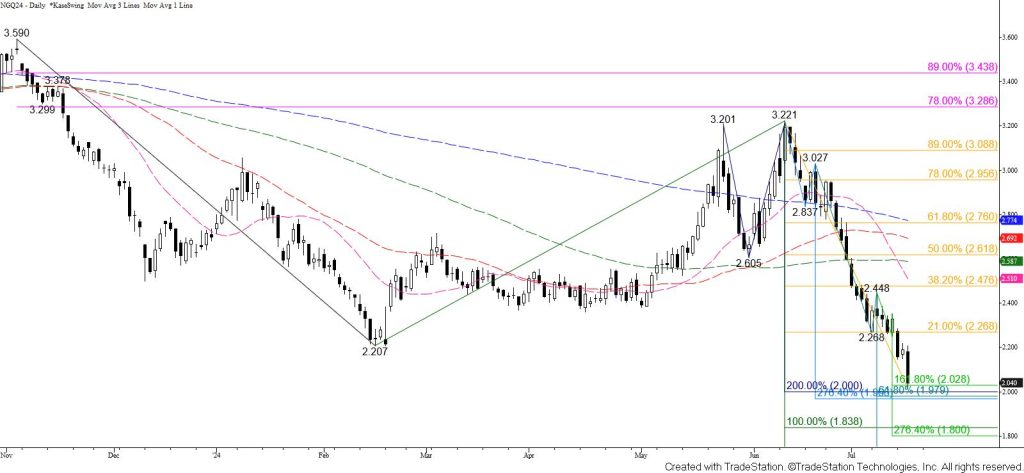
This is a tight call for the near term because daily trend indicators remain bearish, the downtrend is intact, and the wave formation calls for a test of $1.97 and lower. However, daily bullish KaseCD and MACD divergences confirmed at the $2.015 swing low and the fact that $2.11 held on a closing basis warn that a larger test of resistance might still take place in the coming days.
Given the close above $2.11 was nominal, prices held the 38 percent retracement of the decline from $2.270 at $2.17, and natural gas is falling back toward $2.11 late this afternoon the near-term outlook leans bearish. A test of the $2.06 smaller than (0.618) target of the wave down from $2.270 is expected. Closing below this will call for a test of the $2.00 equal to (1.00) target and then the next major objective at $1.97.
That said, should prices rally again and overcome $2.17 look for a test of $2.21 and possibly key near-term resistance at $2.26. The $2.26 level is the smaller than target of the wave up from $2.015. Settling above $2.26 will call for natural gas to rise and test at least this wave’s $2.36 equal to target.