WTI Testing Major Target at $54.0

WTI crude oil is trying desperately to show that a bottom has been made and that a recovery is underway. WTI is testing a crucial decision point at $54.0. This is the 0.618 projection for the wave, $43.58 – 54.24 – 47.36. Most waves that meet the 0.618 projection extend to at least the 1.00 projection, in this case, $58.0. However, a pullback will usually take place first.

Support at $49.9 should hold, but the $47.36 swing low is the level that must hold for the near-term outlook to remain positive. A close below this would negate the wave up from $43.58, and call for a continued decline.

Take a free four week trial of Kase Energy Price Forecasts.

CLH5

For several weeks $2.79 was major support for natural gas. This level was tested many times, and was finally broken after last week’s bearish U.S. Energy Information Administration (EIA) Natural Gas Weekly Update.

Subsequently, prices have fallen to a $2.608 contract low, and $2.79 has become near-term resistance. The $2.79 level is the completion point for a bullish morning star setup, and was tested on Tuesday when prices rose to $2.783. This level is expected to hold for at least the next few days.

NGH5

As of this analysis, Wednesday’s decline has setup a pseudo bearish engulfing line. The bearish engulfing line and other technical factors indicate another bearish EIA number may be expected tomorrow.

Trading will likely be extremely choppy over the next few days, but look for $2.79 to hold and for prices to challenge the $2.608 swing low. Ultimately, the decline is expected to extend to the next major target and bearish decision point at $2.52.

Conversely, a close over $2.79 in the next few days would complete the bullish morning star setup and open the way for an extended correction to the $2.852 confirmation point.

For more information about Kase StatWare please visit the Trading Indicators Page. To take a free trial of Kase’s weekly energy forecasts please visit the Energy Price Forecasts Page.

NY Harbor ULSD future’s upward correction extended to 177.7 on Monday. The primary wave 158.9 – 171.7 – 160.5, met its 1.382 projection at 177.7 and is poised to extend to the 1.618 projection of 184.2. This is the decision point for an extended correction and potential recovery. Although it is too early to say that a bottom has been made, a sustained close over 184.2 would open the way for 198.7 and 217.7. A close below 164.3 would indicate the upward correction is complete and call for 153.2 and lower.

To learn more about Kase’s forecasts please visit the Energy Price Forecasts Page.

HO


Natural gas has positioned itself for a break out of the recent coiling pattern that began forming on January 20. March futures tested the crucial $2.79 area this morning, and most technical factors still favor continued decline. However, March’s inability to close below $2.79 is making this recent range look more like a short-term bottoming formation versus a corrective pattern. In addition, a bullish KasePO divergence and first class long permissions (blue dots) for the KEES indicator on the 240-minute equivalent Kase Bar chart indicate prices may attempt to rise above $3.01 again after tomorrow’s U.S. Energy Information Administration (EIA) Natural Gas Weekly Update.

NGH15

The key for a break higher will be a close over $2.97. This is the 0.618 projection for the wave $2.762 – 3.957 – 2.81. March already stalled at this level once, but overcoming $2.97 would open the way for $3.01, which then connects to $3.08 as the 1.382 projection. The $3.08 level is also near the top of the window that took place between January 16 and 20, so a close over this in coming days would be bullish for the near-term outlook.

That said, even though March has held $2.79 on a closing basis thus far, it has not been able to maintain momentum behind any recent price rise. If natural gas cannot break higher this week, the odds of an extended upward correction will quickly diminish. A close below $2.79 would then open the way for the next leg down, where the first target of that move is $2.71.


Last week’s natural gas price rise was poised to fill December 22nd’s gap from $3.48, but the upward correction stalled at $3.352. The week settled above the $3.09 midpoint of Wednesday, January 12th’s candlestick, leading to speculation that the market might try to rise again early this week. However, Monday’s intraday gap down from $3.056 and settle back below $3.00 was negative for the near-term outlook.

There is still major support at $2.80 that has held so far, but after this morning’s move up stalled and failed to fill to $3.056 gap it looks as though a bearish U.S. Energy Information Administration (EIA) Natural Gas Weekly Update is expected tomorrow.

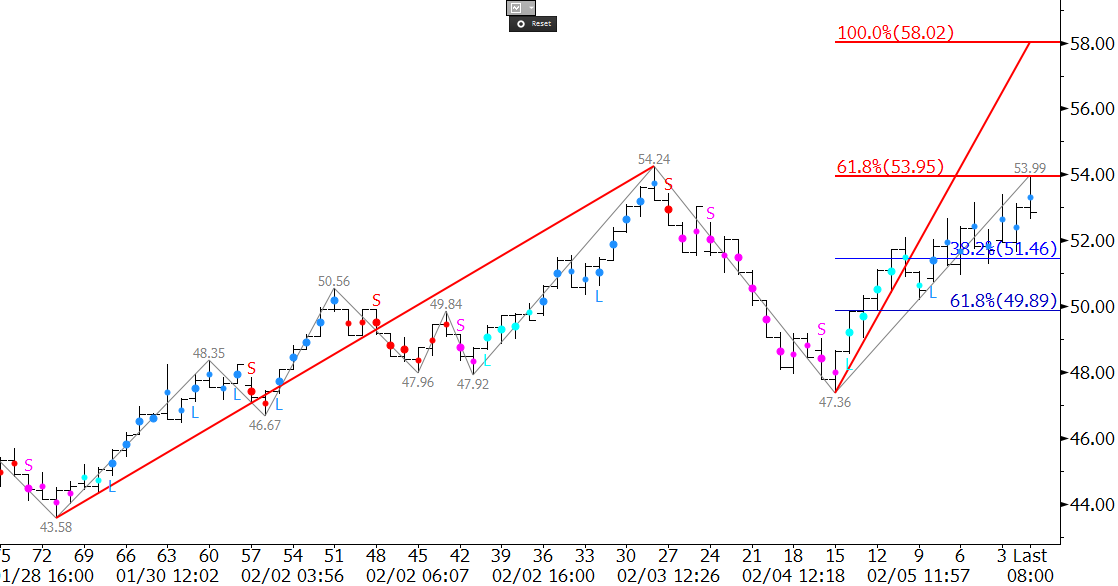
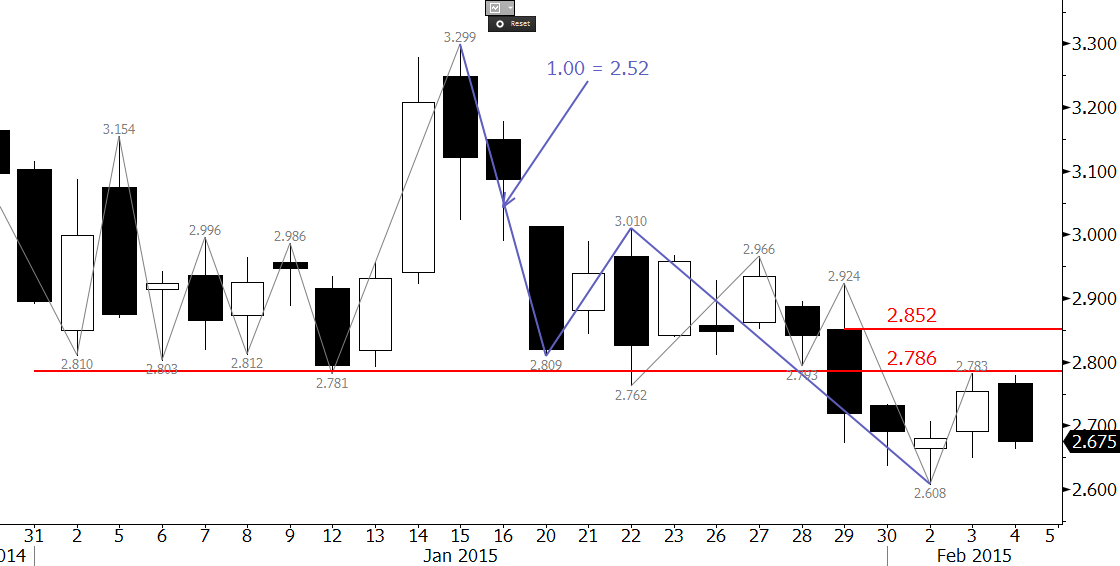
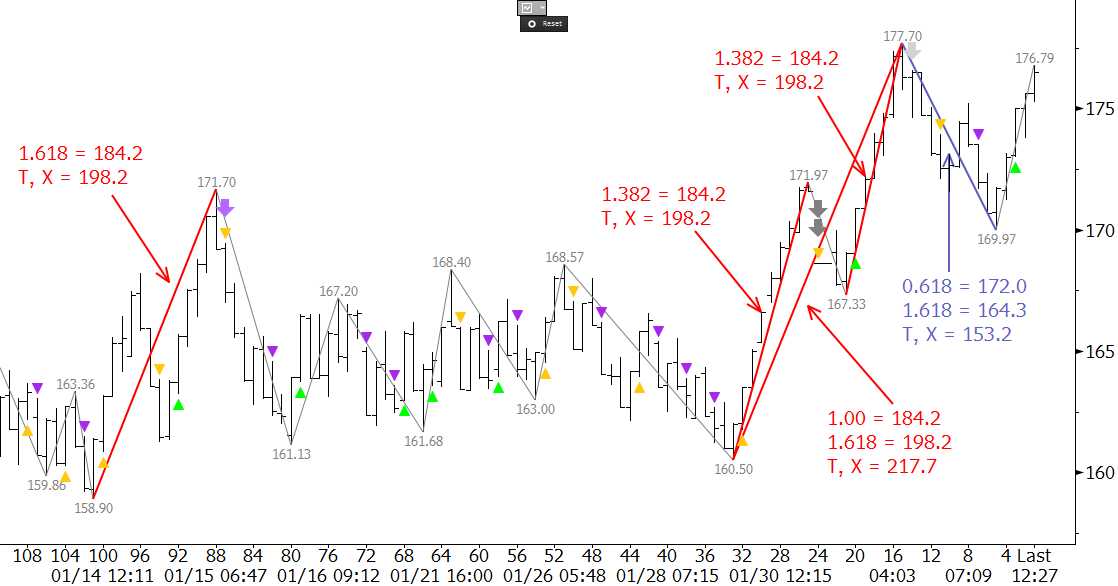
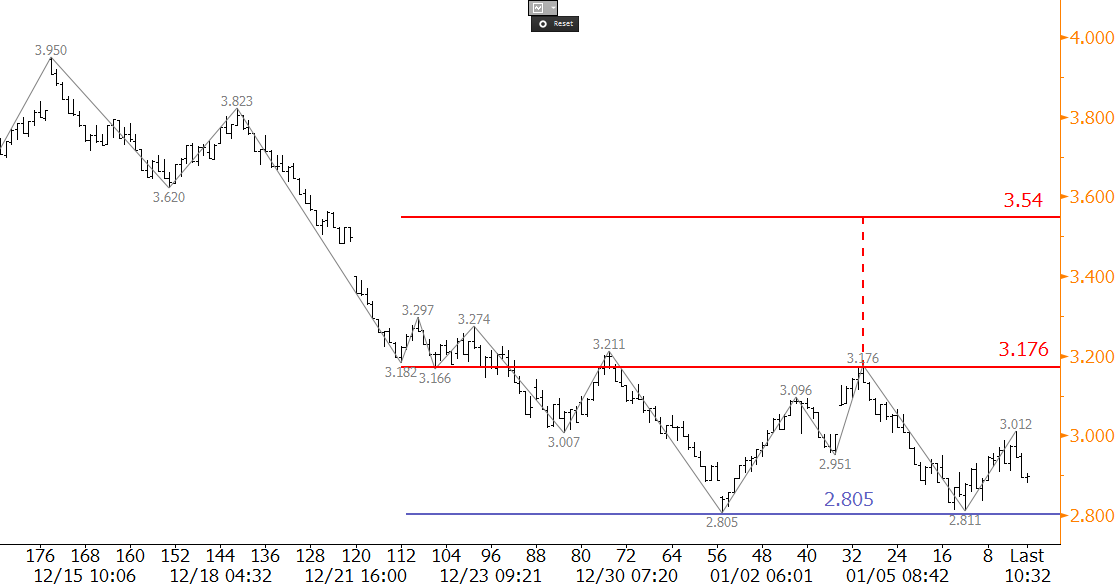
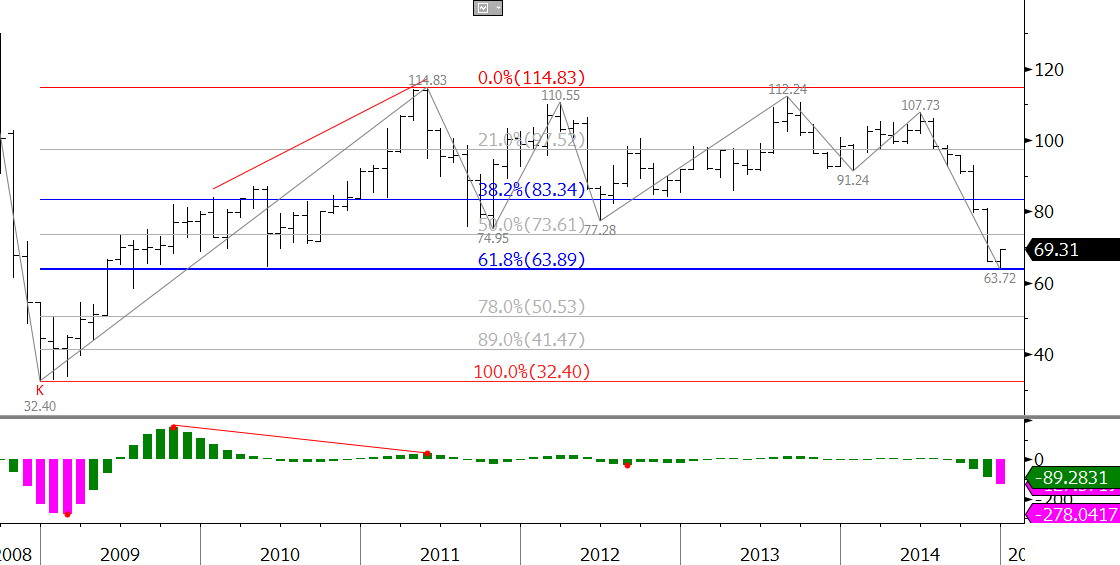
The key wave for the short-term is $3.352 – 3.024 – 3.228. This wave has already fallen below its 1.00 projection at $2.90 and is poised to meet at least its 1.382 projection at $2.77. This then connects to $2.66 as the 1.618 projection. The $2.66 target is highly confluent for many of the larger and earlier waves down, and is the 0.618 projection for the wave $3.95 – 2.783 – 3.352. The confluence is important because a sustained close below $2.63 would open the way for a decline into the mid-to-low $2’s over the course of the longer-term. Therefore, $2.63 is a potential stalling point for the decline.

nat gas

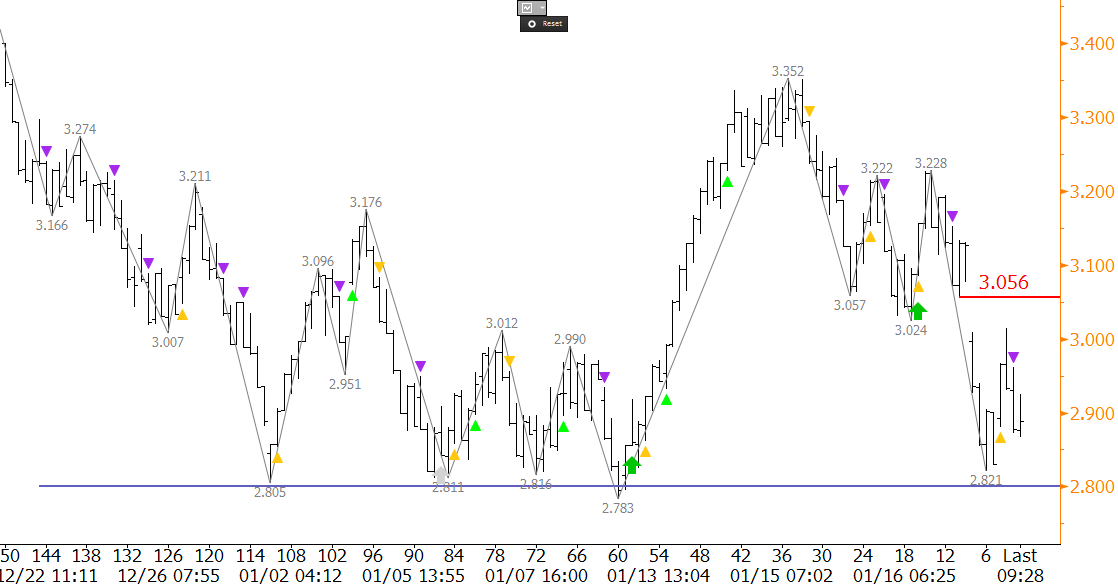
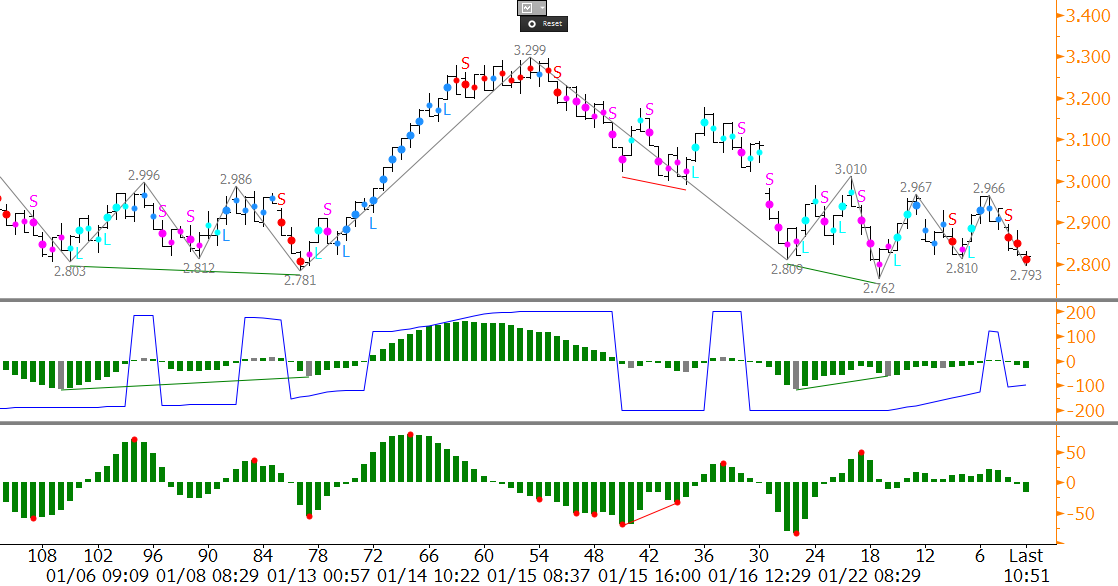
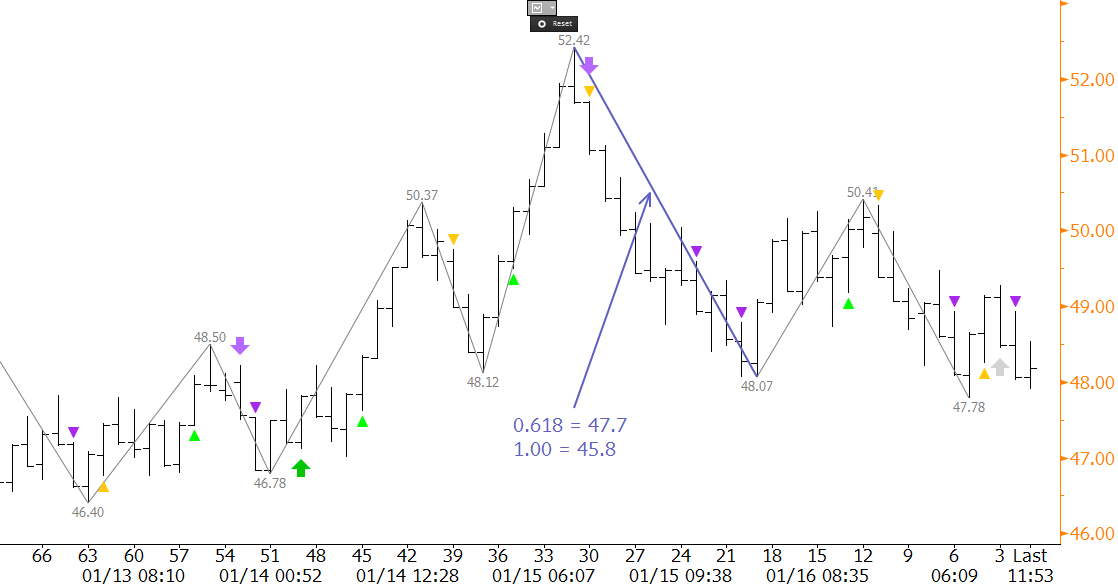
The KaseX indicator on the 240-minute equivalent Kase Bar (KBAR) also confirms the negative outlook and has generated several short signals (purple arrows) during the decline from $3.352. The most recent short signal came after the $3.015 swing high this morning. At this point, there are no warning signals that indicate profit should be taken or that short trades should be exited. This will likely change though should prices recover above the $3.015 swing high.

First resistance ahead of the EIA report is $3.06, which is near the top of the $3.056 gap. A move above this would call for 3.15, which is the 0.618 projection for the wave $2.783 – 3.352 – 2.821. The $3.15 level is confirmed as the 62 percent retracement from $3.352 to $2.821. It is also interesting to note that this morning’s rise to $3.015 stalled just below the 38 percent retracement at $3.02. This is another negative factor.

To summarize, the bias is negative, and the move down is expected to continue. There is strong support at $2.80, but a move below this would call for at least $2.77 and very likely $2.66. Resistance at $3.06 will likely hold, but a move above that would open the way for at least $3.15.

For more information about KaseX please visit our Trading Indicators Page. To take a trial of Kase’s in-depth weekly energy forecasts on natural gas and crude oil please visit the Energy Forecasts Page.


Brent has been trading in a corrective range for the past several days, but fell to major support at $47.7 on Tuesday. This is the 0.618 projection for the wave $52.42 – 48.07 – 50.41. The $47.7 projection connects to a major target at $45.8 as the 1.00 projection. This is also the 1.618 projection for the largest and most important wave down from the $111.38 contract high. KaseX confirms the negative call with confirmed short signals (purple triangles) on the 120-minute equivalent Kase Bar chart.

For more information about KaseX please visit our trading indicators page. The learn about our forecasts please visit our energy forecasts page.

Brent

The outlook for natural gas is negative, and without help from external factors the decline will likely continue. However, the market is hesitant to break support at $2.80 in the near-term, and is likely waiting on tomorrow’s U.S. Energy Information Administration (EIA) Natural Gas Weekly Update before it presses higher or continues to decline.

Several positive technical factors indicate resistance will likely be tested before tomorrow’s EIA report. A small intraday double bottom formed at $2.805, as shown on the 120-minute equivalent Kase Bar chart. The confirmation point for the double bottom is $3.176, which is in line with the 1.00 projection for the wave $2.805 – 3.176 – 2.811. Immediate resistance is $3.04, the 0.618 projection. A move above $3.04 would call for $3.176 to be challenged, and a close over $3.176 would confirm the double bottom. This would then open the way for an extended correction to targets between $3.18 and the double bottom’s $3.54 target (calculation is 3.176 + (3.176 – 2.805) = 3.537). A move of this magnitude will not likely take place without major support from bullish external factors.

NGG

Should $3.176 hold, the move down will likely extend. First support is $2.89, and a close below this would call for a key target at $2.79. This is the 0.618 projection for the wave $3.176 – 2.811 – 3.012. A close below $2.79 would negate the double bottom and open the way for targets in the mid $2s.

Overall, the outlook is negative, and the move down is still favored. However, the double bottom, a daily morning star setup, and deeply oversold conditions, all indicate that a correction may take place very soon, and could be spurred by tomorrow’s EIA report.

Visit the Kase Energy Forecasts Page to sign up for a free trial of Kase’s weekly energy forecasts on natural gas and crude oil.

February 2015 WTI crude oil broke lower out of a coil formation on Friday and continued its decline on Monday, December 29. The target for the coil is $49.8, and is in line with a highly confluent $49.7 objective that we have discussed as a potential stalling point for several weeks. A close below $49.7 would open the way for $46.9 and $45.5. Initial resistance is $56.0, the apex of the coil. Key resistance is $61.8, which is near the coil’s $62.1 upper target.

Take a trial of Kase’s weekly energy forecasts to get more in depth analysis, targets, and probabilities.

clg5

The NY Harbor ULSD futures broke lower out of a bearish flag formation on Monday. The break lower was anticipated and then confirmed by KaseX short signals. The decline is now poised to extend to at least 188.9 and then 177.9. The latter is crucial because a close below this would call for 164.1 and 151.9. Initial resistance is the small intraday double top at 199.39. A close over this would open the way for an extended correction to 210.9 and possibly 226.0.

For more information about KaseX please click here.

For more information about Kase’s weekly energy forecasts please click here.

HO1


The outlook for WTI Crude Oil is negative, but prices met crucial support at $63.4. This is a confluent wave projection for the January contract, and more importantly, is the 62 percent retracement from the perpetual low of $32.4 to $114.83. In addition, the KaseCD is oversold on the monthly chart. The importance of $63.4 indicates it is a potential stalling point, but there is little technical evidence so far to definitively call for a bottom. A sustained close below $63.4 will call for $49.7. Key near term resistance is $73.3.

For more detailed energy forecasts please take a trial of the Energy Price Forecasts.

CL1