Natural Gas Technical Analysis and Near-Term Outlook
This is a brief analysis for the next day or so. Our weekly Natural Gas Commentary and daily updates are much more detailed and thorough energy price forecasts that cover key natural gas futures contracts, calendar spreads, the UNG ETF, and several electricity contracts. If you are interested in learning more, please sign up for a complimentary four-week trial.
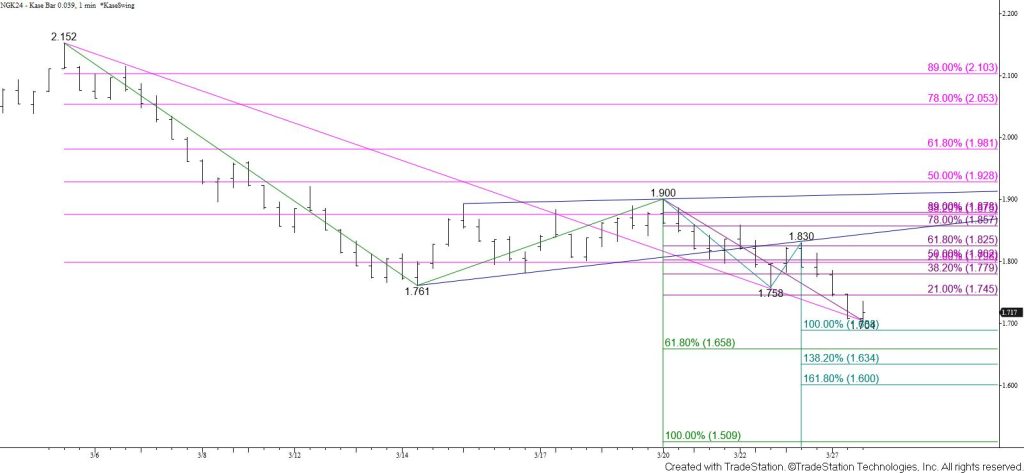
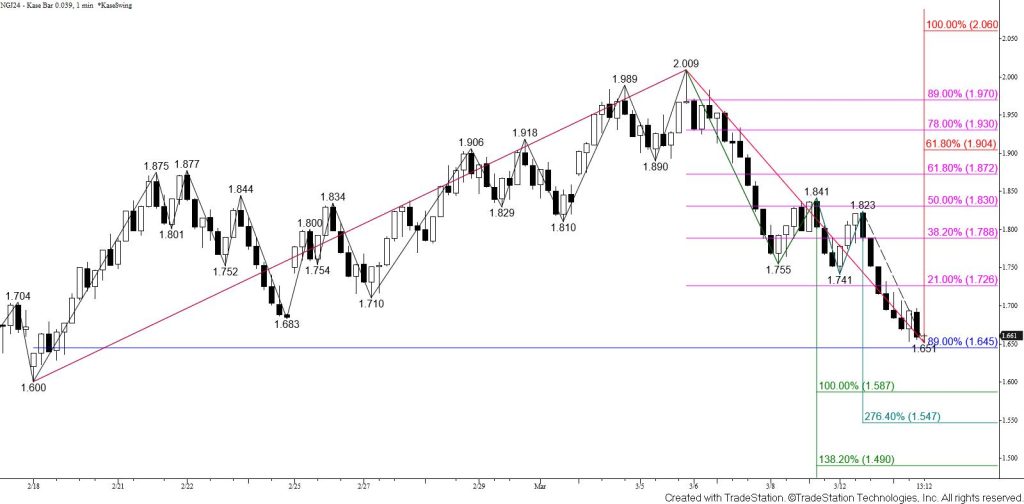
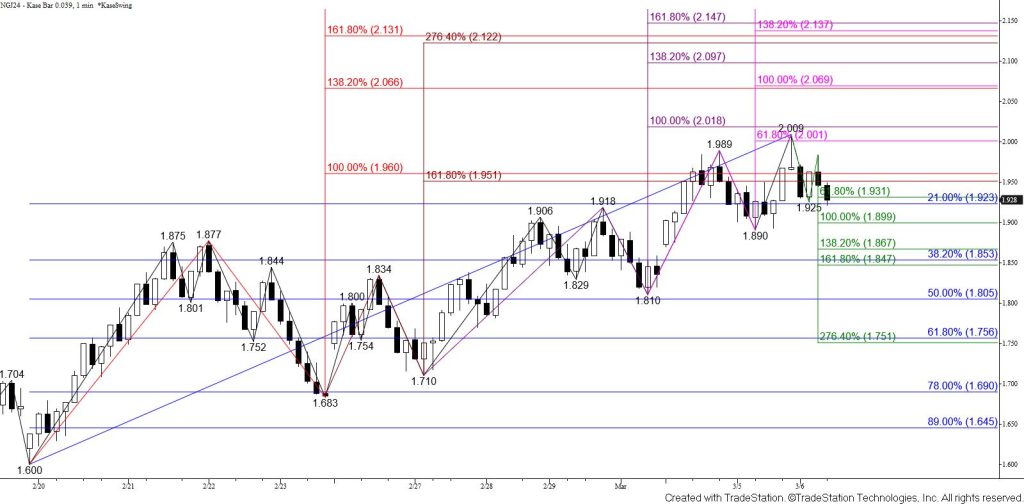
May natural gas fell to a new contract low and finally settled below an important target at $1.76. The move down is now poised to test the $1.69 equal to (1.00) target of the primary wave down from $1.900 and then the $1.66 smaller than (0.618) target of the wave down from $2.152. There is a lot of support around $1.66, so this is a potential stalling point for the May contract. Nevertheless, closing below $1.66 will call for $1.63, $1.60, and eventually a test of the $1.51 equal to target of the wave down from $2.152.
There are no bullish patterns or signals that call for the move down to stall before reaching at least $1.69 and likely $1.66. Today’s decline also negated a daily weak bullish KasePO divergence. Nevertheless, should natural gas rally tomorrow look for initial resistance at $1.75 and key near-term resistance at $1.79. Settling above $1.79 would shift near-term odds in favor of a more significant test of resistance where $1.88 is most important.