WTI Crude Oil Technical Analysis and Short-Term Forecast
This is a brief analysis for the next day or so. Our weekly Crude Oil Forecast and daily updates are much more detailed and thorough energy price forecasts that cover WTI, Brent, RBOB Gasoline, Diesel, and spreads. If you are interested in learning more, please sign up for a complimentary four-week trial.
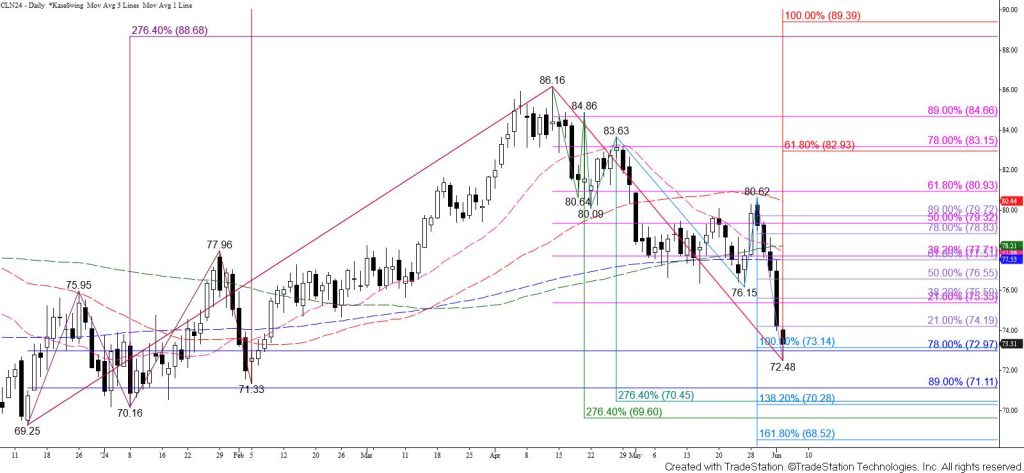
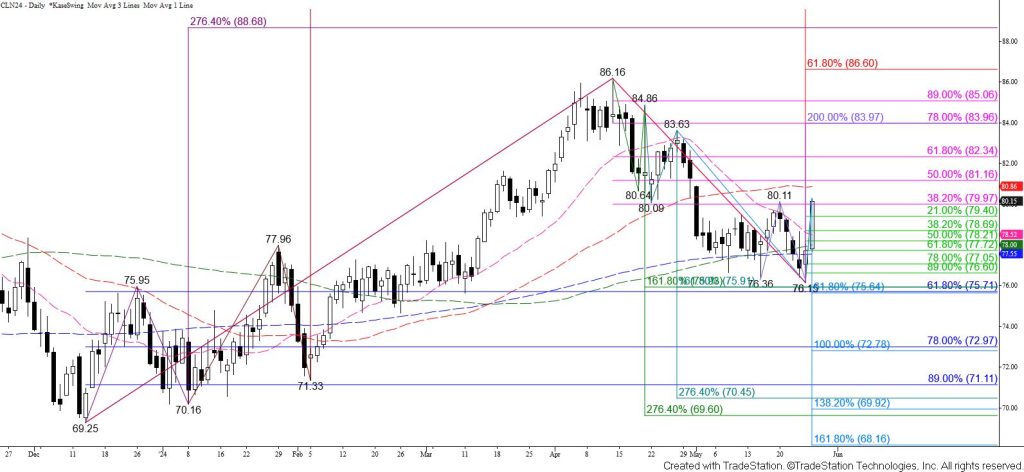
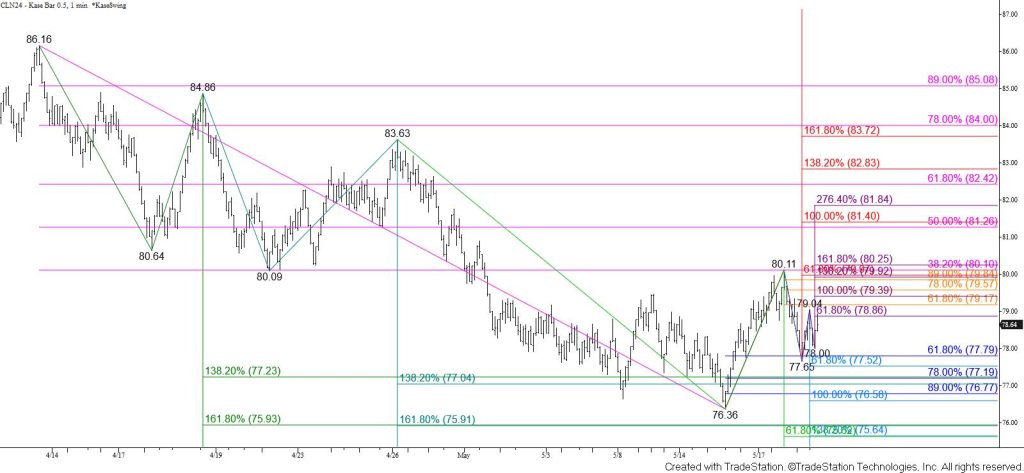
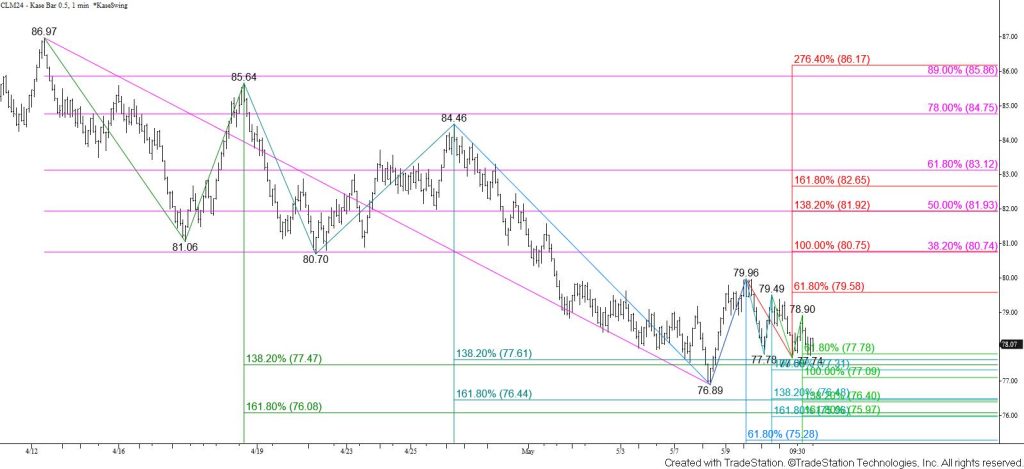
WTI crude oil broke lower out of its recent trading range on Monday and has settled below a bearish decision point at $75.8 for the past two days. The $75.8 objective was the larger than (1.618) target of the waves down from $86.16 and $84.86, the smaller than (0.618) target of the wave down from $83.63, and the 62 percent retracement of the rise from $69.25. The sustained close below the important $75.8 target is bearish for WTI crude oil’s outlook in the coming weeks.
Today’s early move down took out the 78 percent retracement of the rise from $69.25 and equal to (1.00) target of the wave down from $83.63 at $73.0. This level held on a closing basis though. The move down is due for a test of resistance but any move up will likely be a correction. Moreover, the intra-day move up from $72.48 forms a bearish flag. Therefore, the outlook for tomorrow is bearish. Settling below $72.6 will definitively break the $73.0 target and open the way for $72.0, $71.1, and likely another confluent target at $70.4 in the coming days.
The daily RSI and Stochastic are poised to enter oversold territory and the KaseCD and MACD are set up for bullish divergence. The challenge is that there are no bullish patterns or confirmed signals that call for a reversal. Even so, because $73.0 held on a closing basis there is a modest chance for a test of resistance first. Based on current technical factors, resistance at $74.1 will likely hold. Overcoming this would call for a test of key near-term resistance at $75.5. Settling above $75.5 would call for an extended correction to challenge $76.6 and possibly a key level at $77.6.