Natural Gas Forecast: December’s Wave Structure Calls for $2.11

By Dean Rogers

As discussed last week, everyone is looking for the natural gas bottom. I am sure no one wants me to step back onto my “picking bottoms is a dangerous game” soap box, so I will just reiterate that the best anyone can do is identify potential turning points and look to time entries and exits that fit their trading style, risk appetite, and goals.

With that in mind, let’s discuss the potential turning points for natural gas at today’s $2.263 swing low and at $2.11, the latter of which I think is the most likely point for a bottom to be made.

December’s wave structure down from $3.391 has unfolded in a five-wave pattern. We are not Elliott Wave fanatics or strict practitioners, but when a textbook pattern forms we pay attention.

Below are some of the basic Elliott Wave rules we abide by and look for when a five-wave pattern forms.

Basic Elliot Wave Rules, according to Kase:

  • A five-wave pattern is made up of three impulse waves and two corrective waves
  • Two of the three impulse waves should be equal in size
  • The impulse waves, labeled I, III, and V, should break down into five sub-waves.
  • Wave III cannot be the smallest impulse wave
  • Waves I, III, and IV should be proportional to one another (0.618, 1.00, 1.382, 1.618, etc.)

For the five-wave pattern down from $3.391 wave I met its 1.618 projection at $2.607 (end of wave III) and trend terminus (2.9693/3.3912) at $2.263 (potential end of wave V). The lowest that wave I projects is $2.12 as the 2.764 extension.

NGZ5 20151028

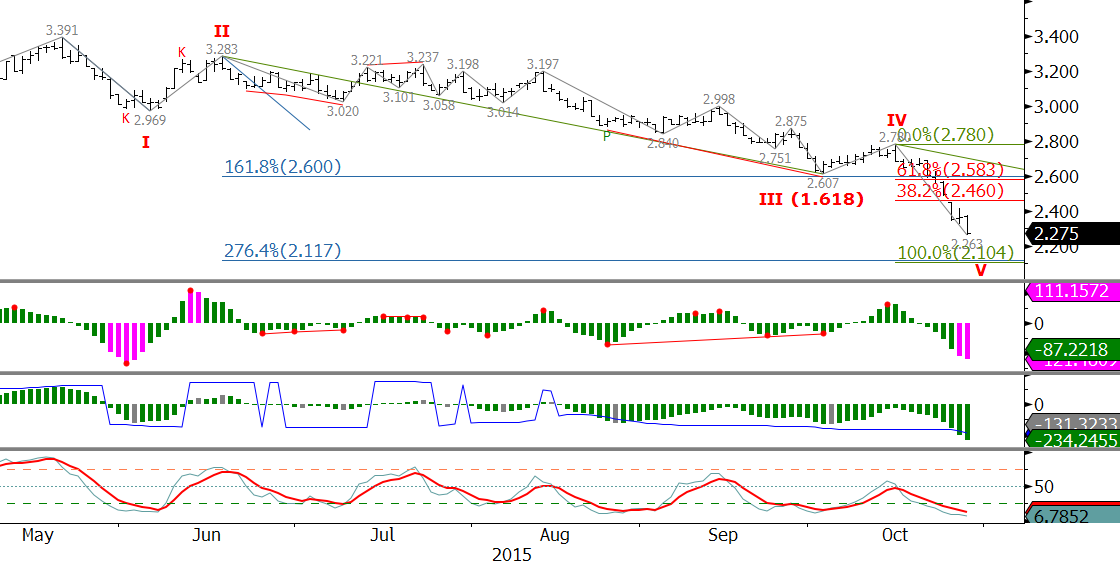
Given the importance of $2.263, the ticks up after the close, and oversold conditions on the KasePO, KaseCD, and slow stochastic, prices might turn higher from this level.

However, at this point there are not two equal waves. At $2.36 waves I and V were equal, but prices fell to $2.263. At $2.10 waves III and V will be equal. Therefore, based upon the basic Elliott Wave Rules, December will likely fall to the confluence point of $2.11 where wave I will have met its 2.764 projection and waves III and V will be equal.

From $2.11 we would expect to see a three-wave correction, and because of the time of year, a significant rally as the market heads into the winter heating season. A sustainable rally will be confirmed by a KasePO PeakOut, KaseCD KCDpeak, and %K over %D crossover as momentum rises out of oversold territory on the slow stochastic.

There are no guarantees that $2.11 will hold over the course of the longer-term, but this has become the most likely point at which a bottom will be made.

This is a brief natural gas forecast ahead of tomorrow’s EIA report. Our weekly Natural Gas Commentary is a much more detailed and thorough analysis. If you are interested in learning more, please sign up for a complimentary four week trial.

By Dean Rogers

December WTI’s wave $39.22 – 50.89 – 44.31, which met its 0.618 projection at $51.42, has been taken out by the $43.64 swing low. Consequently a technical failure of the move up has taken place and odds have shifted in favor of a continued decline. Look for $43.0 tomorrow and very likely $42.5 over the next few days. A close below $42.5 would confirm the negative outlook and technical failure. There is an outside chance that the support trend line will hold. Look for resistance at $45.4 and $46.5.

CLZ5 20151026

This is a brief analysis and outlook for the next day or so. Our weekly Crude Oil Commentary is a much more detailed and thorough energy price forecast. If you are interested, please sign up for a complimentary four week trial.

By Dean Rogers

This is the time of year when everyone is looking for a bottom and pre-winter rally for natural gas. The logic and seasonal timing make sense, but picking bottoms is a dangerous game. Those that successfully time the bottom are more lucky than good. The best that most mere mortals can hope for is to be prepared for the turn so that they can react in an effective manner that fits their goals, strategy, and risk appetite.

This is why it is important to have a forecast and directional opinion (and yes, sideways is a direction) about the market in addition to a set of reliable indicators like Kase StatWare or KaseX to time entries and exits. The forecast is the framework for the market that lets you know where key support and resistance are and when you can expect correction and potential trend reversal. Indicators tell you when to get in, where to place stops, and when to get out.

For instance, $2.40 was major support for November natural gas. This was a highly confluent target, and we had discussed this level as a potential stalling point for many weeks (even months) leading up to the decline to $2.403 on October 2. However, the subsequent move up was shallow, choppy, and corrective. Long trades could have been taken on shorter bar lengths during the corrective move up, but in our detailed weekly forecasts and mid-week blog updates we anticipated another decline and test of $2.40 because the market was struggling to overcome key resistance levels at $2.48 and $2.59.

November fell to $2.41 on October 16 and started to bounce again. The move stalled at $2.50 on Tuesday, October 20 and prices fell to new lows for November and the winter contracts on Wednesday, October 21.

NGX5 20151021

$2.40 has held so far on a closing basis, but a sustained close below this level will open the way for at least $2.33, the 1.00 projection for the wave $2.578 – 2.41 – 2.499 and very likely $2.27. The latter is a confluent objective for the waves down from $2.859, $2.72, and $2.578 making it the next potential point at which a bottom could be made.

Most technical factors are negative and there is little evidence that the decline is going to stall. However, the importance of support at $2.33 and especially $2.27 indicate that we should be prepared for at least another correction and a potential bottom soon. Keep a close eye on your indicators to tell you when to time your entries and watch for closes above key resistance levels to confirm the move down has ended.

For now, initial resistance is $2.45 and key resistance, for the near term, is $2.50.

This is a brief natural gas forecast ahead of tomorrow’s EIA report. Our weekly Natural Gas Commentary is a much more detailed and thorough analysis. If you are interested in learning more, please sign up for a complimentary four week trial.

By Dean Rogers

December WTI’s wave $39.22 – 50.89 – 44.31 met its 0.618 projection at $51.42. This was positive, especially due to the break higher out of the bullish pennant formation. We anticipated the pullback from $51.42, but so far it has been stronger than expected and is poised to test major support levels at $46.0 and $44.3.

Kase’s studies show that waves that meet the 0.618 projection extend to the 1.00 projection 80 percent of the time. This would have pushed prices to $56.0. However, the pullback from $51.42 has been strong and closed below $47.0 support on Monday. Therefore, this may be 20 percent of the time that a wave fails to meet its 1.00 projection.

CLZ5 20151019

First support is $46.0, and a close below this would open the way for $44.31. This is the swing low of the wave up from $39.22 and is in line with the 0.618 projection of the wave down from $51.42. Taking out $44.31 would result in a technical failure of the move up and call an extremely bearish outlook for foreseeable future.

Look for immediate resistance at $46.9, $47.6, and then $48.4.

This is a brief analysis and outlook for the next day or so. Our weekly Crude Oil Commentary is a much more detailed and thorough energy price forecast. If you are interested, please sign up for a complimentary four week trial.

By Dean Rogers

Spot natural gas is still looking a bit unsure of the move up, but the forward months, especially the winter strip, are looking reasonably positive. This likely indicates that a longer-term move up is underway, but for now it is looking like the prompt month could settle into a choppy trading range while it awaits more data (weather) to push natural gas prices higher or lower.

November futures stalled at $2.559 before reaching crucial resistance at $2.57. Tuesday’s bearish engulfing line was followed by a positive move on Wednesday. Resistance at $2.57 should be tested. A close over $2.57 would call for $2.63 which then connects to $2.68. First support is $2.49, but the key level for the near-term is near $2.43. A close below this would confirm the move up has failed and would open way for a new low.

NGX5 20151014

This is a brief natural gas forecast ahead of tomorrow’s EIA report. Our weekly Natural Gas Commentary is a much more detailed and thorough analysis. If you are interested in learning more, please sign up for a complimentary four week trial.

By Dean Rogers

Last week’s break higher out of the bullish pennant was positive and the move up extended to meet the 0.618 projection of the wave $38.51 – $50.04 – 43.71. However the move stalled there, formed a bearish evening star and blow-off high, and then proceeded to test $46.4, the 62 percent retracement of the move up from $43.71.

CLX5 20151013

The market is telling us that it needs more time to sort itself out as it awaits more data. We have stated that the move up would likely be a grind higher, and so far that has been the case.

For now, another trading range will likely form between $46.4 and $50.0. Look for resistance at $47.4 and $48.2.

Should prices fall below the $43.71 swing low the outlook will shift back to negative for the longer-term.

This is a brief analysis and outlook for the next day or so. Our weekly Crude Oil Commentary is a much more detailed and thorough energy price forecast. If you are interested, please sign up for a complimentary four week trial.

By Dean Rogers

November natural gas had worked its way higher to challenge key resistance at $2.53 over the past few days after meeting major support at $2.403 last week. The move up has been shallow and choppy compared to the decline and could be interpreted as a bearish expanding wedge. The market also keeps giving back its intraday gains at the end of each day, which indicates hesitance to continue higher. This point is emphasized by the formation of an intraday double top at $2.53.

NGX15 20151008

The completion point for the double top is $2.45, which is also in line with the wedges lower trend line. A close below this would confirm the double top and a break lower out of the wedge, opening the way for another test of $2.40 and possibly lower.

That said, a few positive factors, including bullish daily divergences and a morning star still show that the upward correction could extend to $2.60. The key for a move of this magnitude is for $2.45 to hold and a close over $2.53. The latter is the morning star’s confirmation point, the 1.00 projection for the wave $2.403 – 2.491 – 2.436, and the 38 percent retracement from $2.72 to $2.403.

On balance, with all factors considered, it is looking more and more like natural gas will settled into a trading range between $2.40 and $2.53 for a few weeks while awaiting external factors (weather) to sort out the direction for the next few months.

This is a brief natural gas forecast. Our weekly Natural Gas Commentary is a much more detailed and thorough analysis. If you are interested in learning more, please sign up for a complimentary four week trial.

5c1050e7d305921d3b87cdb35a1e42ffby

Read on TraderPlanet

“Ask Kase” and your question may be chosen as the subject of a future column (askkase@kaseco.com).

With VW cheating on diesel fuel emissions and standards being scrutinized worldwide, interest in electric vehicles may increase longer-term, and medium-term, gasoline fueled vehicles might pick up. But will gasoline prices get a boost any time soon? Probably not.

December gasoline, which becomes prompt in two days, traded up to $1.4604 at the end of August. Since then it’s been caught in a downward oscillating pattern, but remains above its earlier $1.1756 low.

Odds favor the downside. This was a large down month which prevented a bullish reversal pattern from completing. On the daily chart, the decline to and bounce up from $1.1756 was a bullish V-bottom but failed. The decline from $1.4604 was interrupted by a bullish flag which has since broken lower. The perpetual has been steadily dropping since mid-June, only going into a sideways stall during the past two weeks.

RB-Fig1

Charts created using TradeStation. ©TradeStation Technologies, Inc. 2001-2015. All rights reserved. No investment or trading advice, recommendation or opinions are being given or intended.

Odds of a recovery are higher than for a normal trending market. The decline from $1.4604 only met the minimum 0.62 extension. The decline has also been shallow.

Two very strong layers of support are $1.235 and $1.205, respectively the 78 percent and 89 percent retracements of the $1.1756 to $1.4604 rise. $1.235, less than one cent above the perpetual’s January low, is important because it’s only generated by the waves down from $1.4604. For the six waves down from this price, $1.235 is a wave extension for five, and as a corrective projection for three. Thus, should $1.235 hold, there is no connection to larger, earlier waves which project to lower levels. The next layer at $120.5 connects back to the mid July $1.5828 high. This support level could engender a trading range between the $1.20s and $1.50s, so watch out for that.

Even though the previous low of $1.1756 is natural support, a close below $1.205 could trigger a steep decline down to $1.06. This is because the wave extensions tie the two prices together. The wave 158.28 – 117.56 – 146.04 targets $1.205 as the 0.62 extension and $1.06 as the equal, 1.0, extension. 140.46 – 130.04 – 133.73 targets $1.205 as the 1.38 extension and $1.06 as the 2*1.38 extension. The point is that should there be a close below $1.205, the pull from $1.06 grows.

Adding to that pull is that $1.06 is the 89 percent retracement of the move up from the 2008 low of $0.785 to 3.48. Hitting $1.06 could cause a slide below the $1.00 level.

So watch to see if the two targets in the $1.20s hold – or not.

A close over $1.375 would argue for concern that the move up from $1.1756 will extend. That’s the price above which I wouldn’t hold short-term short position. Above $1.4604 the contract is in for a further recovery. Either way, moderate prices, well below prices should prevail. So fill up the tank, and get on the road before December snows slow you down!

Send questions for next week to askkase@kaseco.com, and click the link to learn more about Cynthia Kase’s latest video series, Kase on Technical Analysis.

By Dean Rogers

After the late August rally WTI settled into a narrowing range that forms a pennant. This is a continuation pattern that indicates odds favor a break higher. However, these odds are somewhat dampened due to the price rise that took place before their formation was small in comparison to the size of the formation. In addition, more than half of the price rise has already been eroded.

wti crude oil

The small wave up from $43.71 indicates that a close over $46.0 would call for $47.0, which is in line with the top of the pennant.

We like support at $44.1 to hold, but $43.0, near the 62 percent retracement of the move up, is the key for a negative outlook.

On balance, even if prices break higher or lower out of the pennant, we could see crude oil continue to oscillate in a wider range for another few weeks while the market sorts out fundamental and geopolitical factors.

This is a brief analysis and outlook for the next day or so. Our weekly Crude Oil Commentary is a much more detailed and thorough energy price forecast. If you are interested, please sign up for a complimentary four week trial.

By Dean Rogers

Natural gas had oscillated in an expanding triangle since August 24. Monday’s break higher out of the pattern was positive, but stalled at $2.794, the 50 percent retracement from $2.959 to $2.632.

The move to $2.794 was healthy because the decline had become stale. The rally gave bears a new opportunity to short the market.

Tuesday’s close below Monday’s $2.73 midpoint formed a daily dark cloud cover (bearish), and Wednesday’s close below $2.70 confirmed the pattern. This is also in line with the 62 percent retracement from $2.632 to $2.794.

natural gas

Caution is warranted and trading will likely remain choppy, but the bearish technical factors indicate another test of $2.63 is expected. A close below this would open the way for the decline to $2.55 and lower have expected for several weeks.

This is a brief natural gas forecast ahead of tomorrow’s EIA report. Our weekly Natural Gas Commentary is a much more detailed and thorough analysis. If you are interested in learning more, please sign up for a complimentary four week trial.