WTI Crude Oil Technical Analysis and Short-Term Forecast
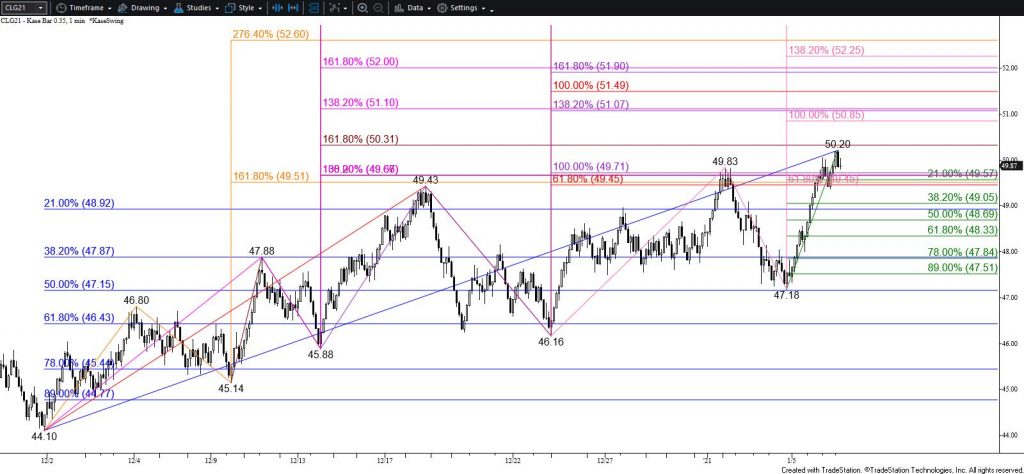
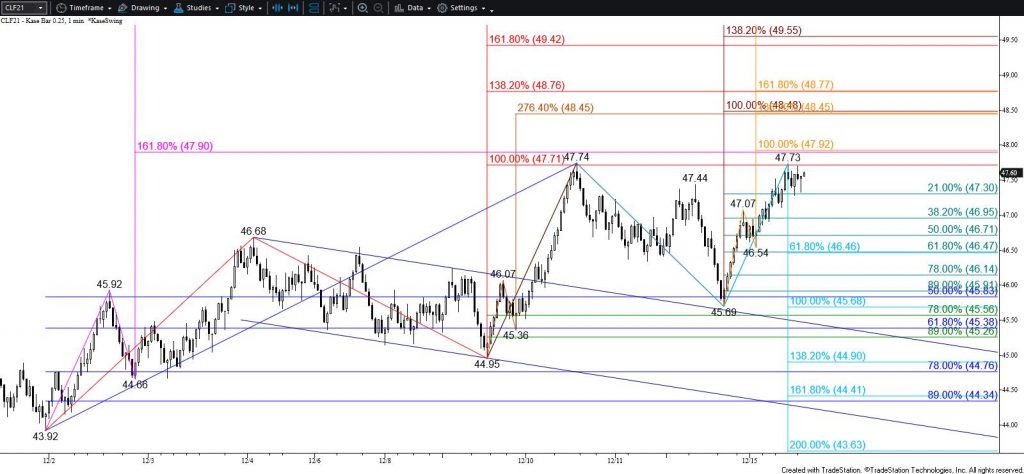
WTI crude oil rallied again today and negated the hanging man and bearish momentum signals that formed Monday. The daily KasePO and RSI momentum oscillators are overbought, the KaseCD and MACD are setup for bearish divergence, and the wave structure is due for a test of support after overcoming the $52.1 equal to (1.00) target of the primary wave up from $27.22. However, the challenge is that each time bearish patterns or signals form WTI rises and wipes out the negative technical factors. The rate at which prices are rising is unsustainable and a significant test of support is expected soon. However, as of this afternoon, there are no bearish patterns or signals that call for the move up to stall, so the near-term outlook remains bullish.
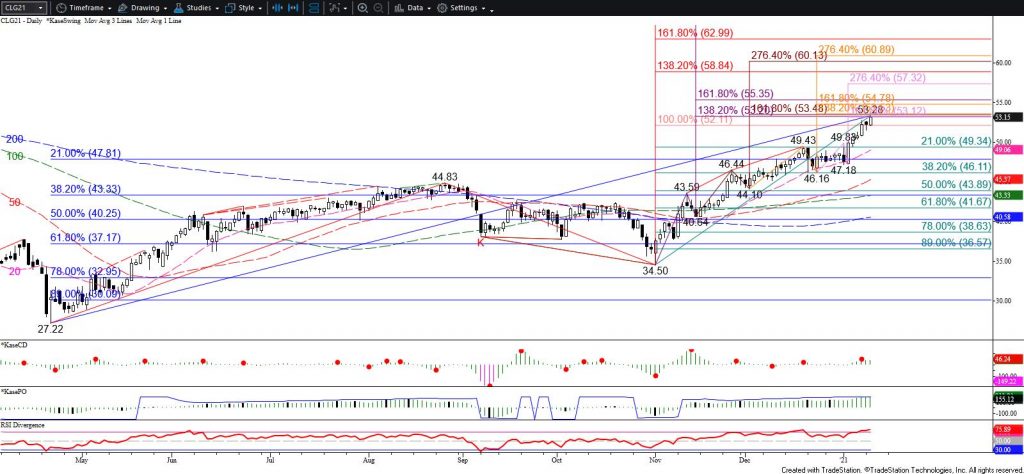
The $53.5 target is the most confluent objective and the next logical stalling point based on the waves and subwaves up from $34.50. Most importantly, this is the intermediate (1.382) target of the primary wave up from $34.50. Upon a close above $53.5, the next probable stalling point is the $55.4 larger than (1.618) target.
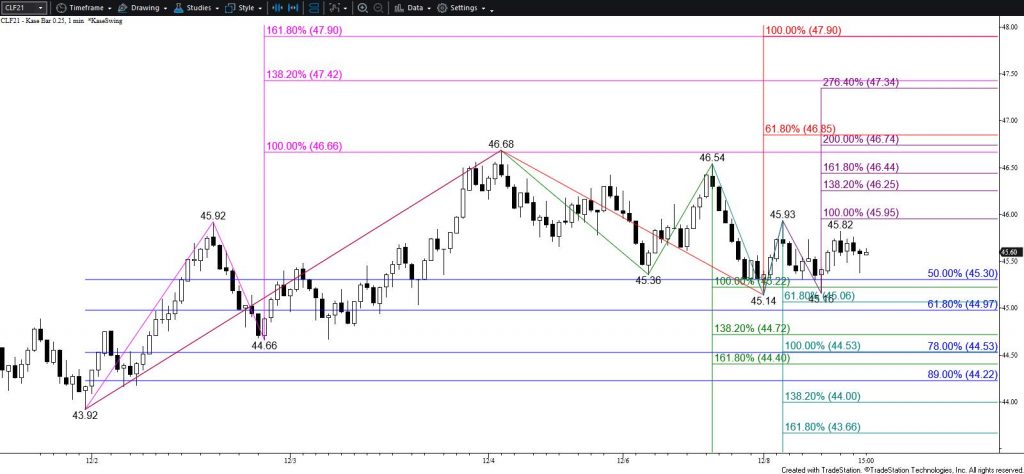
As stated, there are no bearish patterns or signals as of this afternoon that call for the move up to stall tomorrow. Nevertheless, caution is warranted due to the overbought state of the daily RSI and KasePO. Should WTI take out $52.7 look for a test of key near-term support at $52.1. Settling below $52.1 will open the way for a deeper test of support during the next few days with thresholds at $51.6 and $50.9.
This is a brief analysis for the next day or so. Our weekly Crude Oil Forecast and daily updates are much more detailed and thorough energy price forecasts that cover WTI, Brent, RBOB Gasoline, Diesel, and spreads. If you are interested in learning more, please sign up for a complimentary four-week trial.