US Stocks Rolled Off Edge Of Cliff: Now What?

Read on TraderPlanet.com


By Cynthia A. Kase


Read on TraderPlanet.com


Clearly US Stocks have been declining as the drop in demand in China has finally hit hard. It’s easy to sustain robust growth from a low base, but as an economy grows, that becomes more difficult, as China’s machinations show. The spillover to the Dow Jones Index has been evident since mid-May as its been oscillating in a downward pattern since then, bouncing down the cliff, as anyone paying attention will have seen. US Stocks have now rolled off the cliff edge. Now what? Continue reading US Stocks Rolled Off Edge Of Cliff: Now What?

By Dean Rogers

Technical analysis provides traders and market analysts with extremely valuable tools that can help determine future support and resistance and major turning points. A good example of this came from our recent article Ask Kase: How to Trade the Shanghai Index that was published on June 9, 2015 by Cynthia A. Kase, CMT, MFTA. Ms. Kase’s analysis lead her to call for an overdue downward correction of the Shanghai Composite Index (SSE) once resistance at 5200 was met within a +/- 50 point tolerance. SSE rose to 5178.19 on June 12, before turning lower and eventually transitioning into the bearish collapse that has transpired over the past several weeks.

The market has blown through Ms. Kase’s lowest support level of 4550, below which she stated, “a much more sustained decline would commence”. She hit the nail on the head, and now, the techncials are showing us that SSE is poised for at least 2300 after a potential upward correction from 2947.94.

The decline from 5178.19 forms a very clear nested wave formation that has two primary waves: 5178.19 – 3373.54 – 4184.45 (blue) and 4184.45 – 3537.36 – 4006.34 (green). Both waves project to 2300 +/- 80 points. This is a very important target and potential bottom for SSE because it is the 1.00 projection for the wave down from 5178.19 (blue) and the 2.764 projection for the wave down from 4184.45 (green).

shanghai composite index waves

A sustained close below 2300 would call for a much more severe collapse to 2034, 1710, and possibly 1275.

As stated though, an upward correction might take place from 2947.94 before the decline continues. This is because both of the waves down from 5178.19 and 4184.45 met crucial projections around 3000. The 3000 level was also in line with the 62 percent retracement of the move up from the October 2008 swing low of 1664.93 to 5178.19.

To say the least, 3000 is important support, so a small correction to 3350, the 38 percent retracement of the decline form 4006.34 would be normal.

Retracements to 2947.94

shanghai composite index retracements

Key resistance for the near term is 3585, the 62 percent retracement from 4006.34 and the 50 percent retracement from 4184.45. A close over 3585 would open the way for 3755, the 62 percent retracement from 4184.45 and the 38 percent retracement from 5178.19. This is the level that must hold for the outlook to remain negative for at least the next few weeks.

A daily morning star setup (not shown) confirms that the upward correction might take place within the next few days. However, most momentum indicators show that a pullback will be nothing more than a temporary correction.

The weekly stochastic moved below 20 and is oversold, but it can remain there for weeks (or even months) before the index reverses significantly higher. All other momentum indicators, including the KaseCD and KasePO show declining momentum, which does not bode well for the formation of a bottom soon.

shanghai composite index weekly momentum

In summary, most technical factors are negative and odds favor a decline to at least 2300. A pullback from 2947.94 might take place first, but weekly and daily momentum indicators show that such a move will likely be corrective and should hold resistance at 3350 and no higher than 3585. Therefore, for now, buckle in for the rest of the ride lower.

Learn more about Kase’s trading indicators such as the KasePO and KaseCD, weekly crude oil and natural gas forecasts, and other services, at www.kaseco.com.

By Dean Rogers

The world’s supply of crude oil continues to outpace demand, and consequently the global supply glut is being forecast through 2016. WTI fell to its lowest level in over six years last week and Brent is inching its way closer to testing the $45.19 low made on January 13, 2015. A move below this would be the lowest price at which Brent has traded at in over six years.

Structurally, the market is overdue for a correction and Brent’s daily morning star setup, a bullish candlestick pattern, warns that such a correction might take place soon. The decline’s momentum is also weakening, and there are daily and weekly divergence setups for Brent.

Brent and products attempted to stabilize and even rise in a corrective manner last week, but the move stalled. On Friday Brent crude broke lower out of the intraday coil shown below on the $0.50 Kase Bar chart.

brent crude

The break lower out of the coil indicates the decline should continue. The waves projections down from $55.0 (green), $51.69 (light blue), and $50.83 (blue) call for at least $47.9. This is a confluent wave projection that connects to $46.9 and finally $45.5.

The move down is becoming a grind, but until Brent crude can close over at least $49.9, look for the move down to extend. A close over $49.9 would at least create the potential for an extended upward correction.

This is a brief analysis and outlook for the near-term. Our weekly Crude Oil Commentary is a much more detailed and thorough energy price forecast. If you are interested, please sign up for a complimentary four week trial.

By Dean Rogers

For several weeks natural gas has been trading within a range bound between $2.65 and $2.95, and more recently between $2.71 and $2.88. On Wednesday natural gas prices closed at the highest level since May 21 at $2.931, and the first class KEES permissions (blue dots) confirm the positive tone. Natural gas futures are now poised to overcome $2.95 and challenge $3.00. This is a confluent projection for the waves up from $2.656 and $2.706.

natural gas

A close over $3.00 will open the way for an extended upward correction, but keep in mind, this rally may be short lived as the end of summer and its warm weather are rapidly approaching. This upward correction may very well be the last hurrah before the end of summer, and it is going to be a lot easier for longer-term bears to short from $3.00 versus $2.70.

In addition, not only is the market is nearing a past failure point at $2.95, but both the KaseCD and KasePO momentum indicators are setup for bearish divergence. This is a signal that forms when higher price highs are accompanied by lower momentum highs. Bearish divergence is a signal that indicates the move up is exhausted.

Should price turn lower look for support at $2.85 and $2.70. These are the 38 and 62 percent retracements of the move up from $2.706 to $2.934.

This is a brief natural gas forecast ahead of tomorrow’s EIA report. Our weekly Natural Gas Commentary is a much more detailed and thorough analysis. If you are interested in learning more, please sign up for a complimentary four week trial. We also offer trials of our trading indicators.

By Big Hotel ImageCynthia Kase

Read on TraderPlanet.com

The big hotel chains recovered from the financial crisis well and until recent months showed steady gains. Diversification, appealing to differing guests, as well as shifting property ownership to partners helped heat the sector. But now, it looks like supply is catching up with demand, and now the sector is cooling off. To evaluate specifics, I’ve chosen to look at Starwood Hotels & Resorts Worldwide Inc. (HOT) this week as a proxy for its peers.

HOT’s been down for four months running, having lost about 14 percent of its value. The first major downside target is $73.0. If that breaks, a freefall to $65 could ensue, but $70, or $67.5 form interim support. These prices are reflected in the retracement tables shown below

Big Hotel Small Chart
Retracements from Lows to $87.99


Since Friday, there’s been a small correction, but HOT declined today, August 11. $78 could be tested, and a close over next resistance at $81 would call for a recovery.

Starwood (HOT) Technical Indicators

Looking at the technicals, Starwood’s monthly chart generated a negative divergence back in April based on the KaseCD. Four down months have followed, but lows have not yet reached Kase’s first stop level at $72.83. The stop is near a key target, centered on $73.Big Hotel Chart

The first wave of a pattern is always the most important. Here that’s 87.99 – 79.53 – 86.96, the 1.62 extension for which is $73. If the pattern extends, look for $65, the trend terminus. This is just above Kase’s second stop at $65.8. The most recent wave is 87.99 – 79.53 – 86.96, and $73 is its equal extension as well as the Phi-squared corrective projection.

Backtracking, July 31 was an aberrant, outside, down day. Prices spiked to $86.96 only make a $77.72 low. $73 and $65 are targeted by this day’s waves.

The last four days through Tuesday for a Harami line with stars. The daily chart is oversold, but not divergent. Prices rose about $1.50 from $75.57, but fell today. The wave up targets $78, which is its equal extension, as well as its Phi corrective projection. The wave also targets $81, using three different calculations. This is the “drop dead” price above which the tone becomes positive, and the highest price to which the small wave projects. These two resistance values are the midpoints for the August (so far) and July monthly candlesticks.

Recommended Starwood (HOT) Trading

If I were short above $86, I’d just stay short, perhaps scaling out at $78 and then $81, and exercising caution at the downside targets. Bearish intraday traders might time in here, but watch $73, and use tighter stops. Technically there is little room for optimism, but if you’re long on fundamentals, then monitor the downside targets. Above $81 – you’re “hot”.

Connect with me on LinkedIn for more Market Updates.

By Dean Rogers

For the past eight weeks September WTI crude oil futures have closed lower, and the decline is quickly approaching major support at $42.5. Many pundits claim the sky is falling, but it is usually at times like this that the market will finally find support and at least attempt to make a bottom.

We have discussed $42.5 as major target and potential bottom in our weekly blog update and in our detailed crude oil forecast for several weeks. There is no definitive evidence that the move down is going to end, but on Monday a few positive signs formed that indicate an extended upward correction may take place.

Monday’s bullish engulfing line, exhausted daily KasePO and KaseCD momentum, weekly divergence setups, and the intraday wave up from $43.35 all show that the upward correction may test $45.9 and possibly $47.5 before the decline continues.

wti crude oil

For now, there is no evidence that this will be a major correction, not yet at least, but the fact that the market is starting to show some positive signs of life could mean the move down will end soon.

That said, important resistance was met at $45.01, so we expect to see a pullback to $44.3, Monday’s midpoint, in early trading Tuesday. A close below $44.3 would negate many of the aforementioned positive factors and open the way for $42.5 to finally be met.

This is a brief analysis and outlook for the near-term. Our weekly Crude Oil Commentary is a much more detailed and thorough energy price forecast. If you are interested, please sign up for a complimentary four week trial.

By Dean Rogers

Patience is a virtue.

Natural gas has been trying the patience of traders as it continues to trade in a range between approximately $2.65 and $2.95. This week’s rise from $2.706 is very similar to last week’s move up from $2.735, and given today’s decline and close below $2.80, it looks like another failure to overcome key resistance at $2.89 is taking place…again!

September futures stalled at $2.863, the 62 percent retracement from $2.957 to $2.706. This is also just below $2.892, the 0.618 projection of the wave up from $2.656. The retracements and projections confirm that $2.89 is a key level. A close over this would call for an attempt to overcome $2.95 and break out of the trading range.

natural gas

However, the bearish KaseCD divergence and close below $2.80, the 38 percent retracement from $2.706 to $2.863, indicates prices are now positioned to challenge support at $2.77, the 62 percent retracement. A close below $2.77 would then open the way for another attempt of $2.65 and lower.

The take away this week – be patient.

This is a brief natural gas forecast ahead of tomorrow’s EIA report. Our weekly Natural Gas Commentary is a much more detailed and thorough analysis. If you are interested in learning more, please sign up for a complimentary four week trial.

By Dean Rogers

RBOB Gasoline futures tested support at 167.43 on Monday and have taken out the crucial 169.25 swing low. The outlook is negative, but many technical factors, including Monday’s dip below the lower Bollinger Band, indicate a correction should take place once 160.0 is met. This is the confluence point between the 62 percent retracement of the move up from 122.65 and the 1.618 projection for the primary wave down from 218.58.

gasoline

Look for resistance at 172.3 and 181.3. The latter is expected to hold.

This is a brief analysis and outlook for the near-term. Our weekly Crude Oil Commentary is a much more detailed and thorough energy price forecast. If you are interested, please sign up for a complimentary four week trial.

By Dean Rogers

Natural gas continues to oscillate in a range between $2.65 and $2.95 as weather forecasts change from week-to-week. “Sweltering” heat in the US Northeast is the latest reason reported for this week’s price rise.

However, it is important to keep in mind that the shifting weather forecasts and related events have kept the market range bound for the last few months, and even if prices do break higher the move is still corrective of the longer-term down trend.

If I sound skeptical of the move up, it is because I am, but as of Wednesday’s close most technical factors indicate $2.95 may be challenged again. These factors show that the key to testing $2.95 is a close over $2.87. This crucial resistance level was tested a few times on Wednesday. It is the 62 percent retracement of the decline from $2.957 to $2.735, near last Thursday’s midpoint, and a confluent projection for the small waves up from $2.735. A close over $2.87 would call for a test of $2.95, which is in line with the 0.618 projection of the wave $2.656 – 2.957 – 2.735.

natural gas

KaseX’s buy signal (green diamond) is promising and the pullback from $2.87 held the 38 percent retracement of the move up from $2.735. Look for prices to push above $2.87 in early trading tomorrow and to possibly overcome $2.95 in the event that the EIA storage report is bullish.

Near term support is $2.79, the 62 percent retracement from $2.735 to $2.87. This level should hold provided the move up is going to challenge $2.95. A close below $2.79 would shift the near-term outlook to negative and call for $2.73.

This is a brief natural gas forecast ahead of tomorrow’s EIA report. Our weekly Natural Gas Commentary is a much more detailed and thorough analysis. If you are interested in learning more, please sign up for a complimentary four week trial. We also offer trials of our KaseX trading indicator.

us dollarRead on TraderPlanet.com

By Cynthia A. Kase

On Tuesday pundits were aflutter because the US Dollar had an up day, pointing to expectations that the Fed would soon clarify its intentions to raise rates. Technically, Tuesday was a “star” with a very small range, an inside bar which closed well below Monday’s open. It was indicative, at most, of a wait-and-see stance.

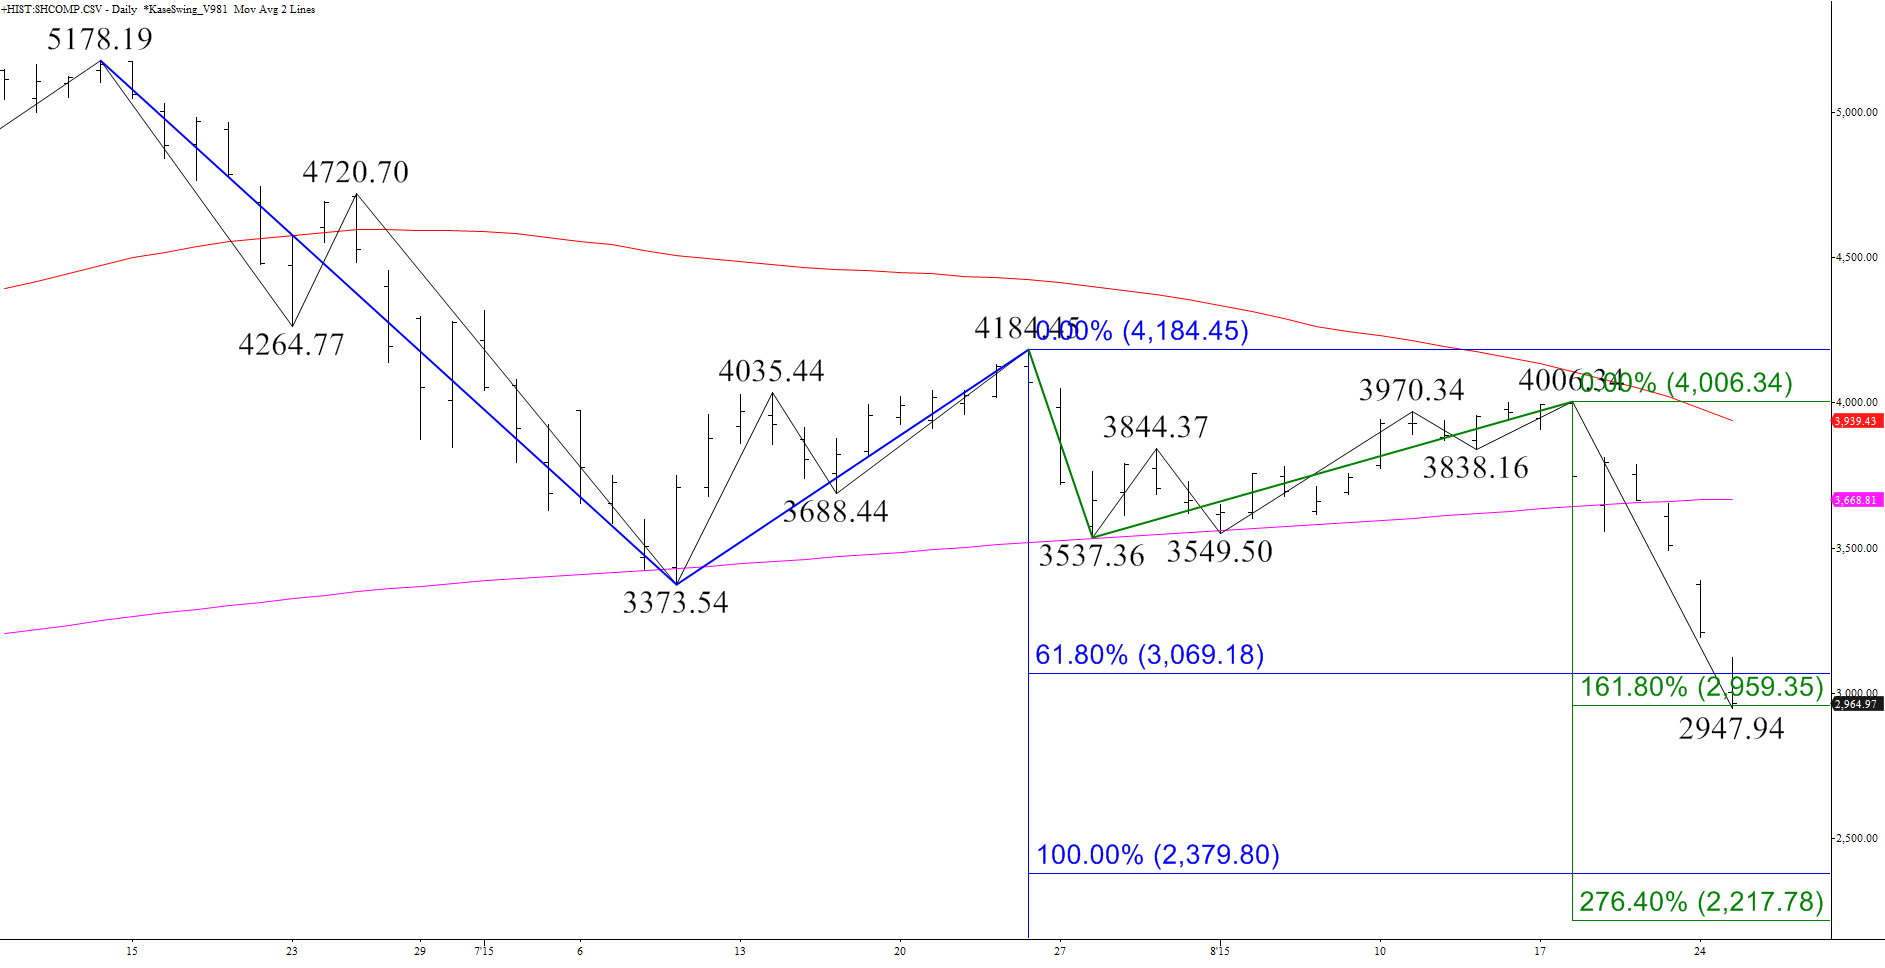
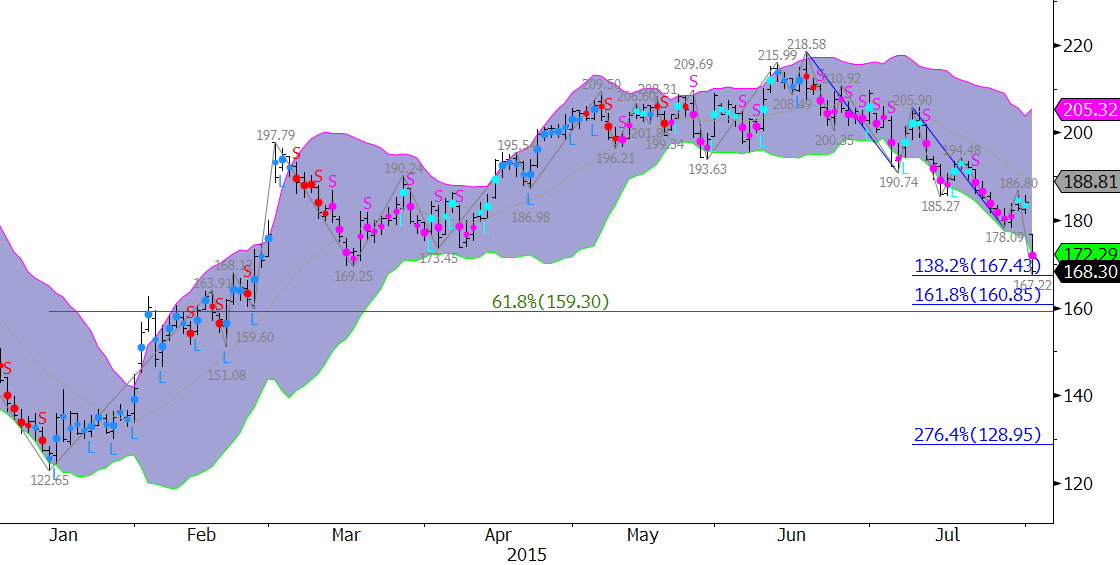
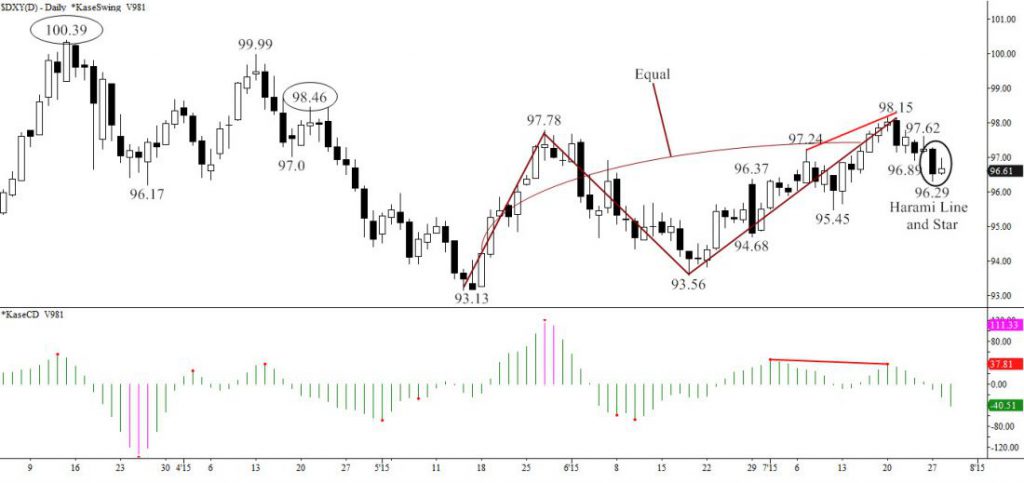
Technically, using the US Dollar index, DXY, the dollar, while not “in the doldrums”, isn’t yet robust. From a chart-driven standpoint, the market’s longer-term structure, viewed from March’s 100.39 high is negative. After five down days, prices are sitting on support. There must be a sustained close over 98.46 to give the dollar a boost.

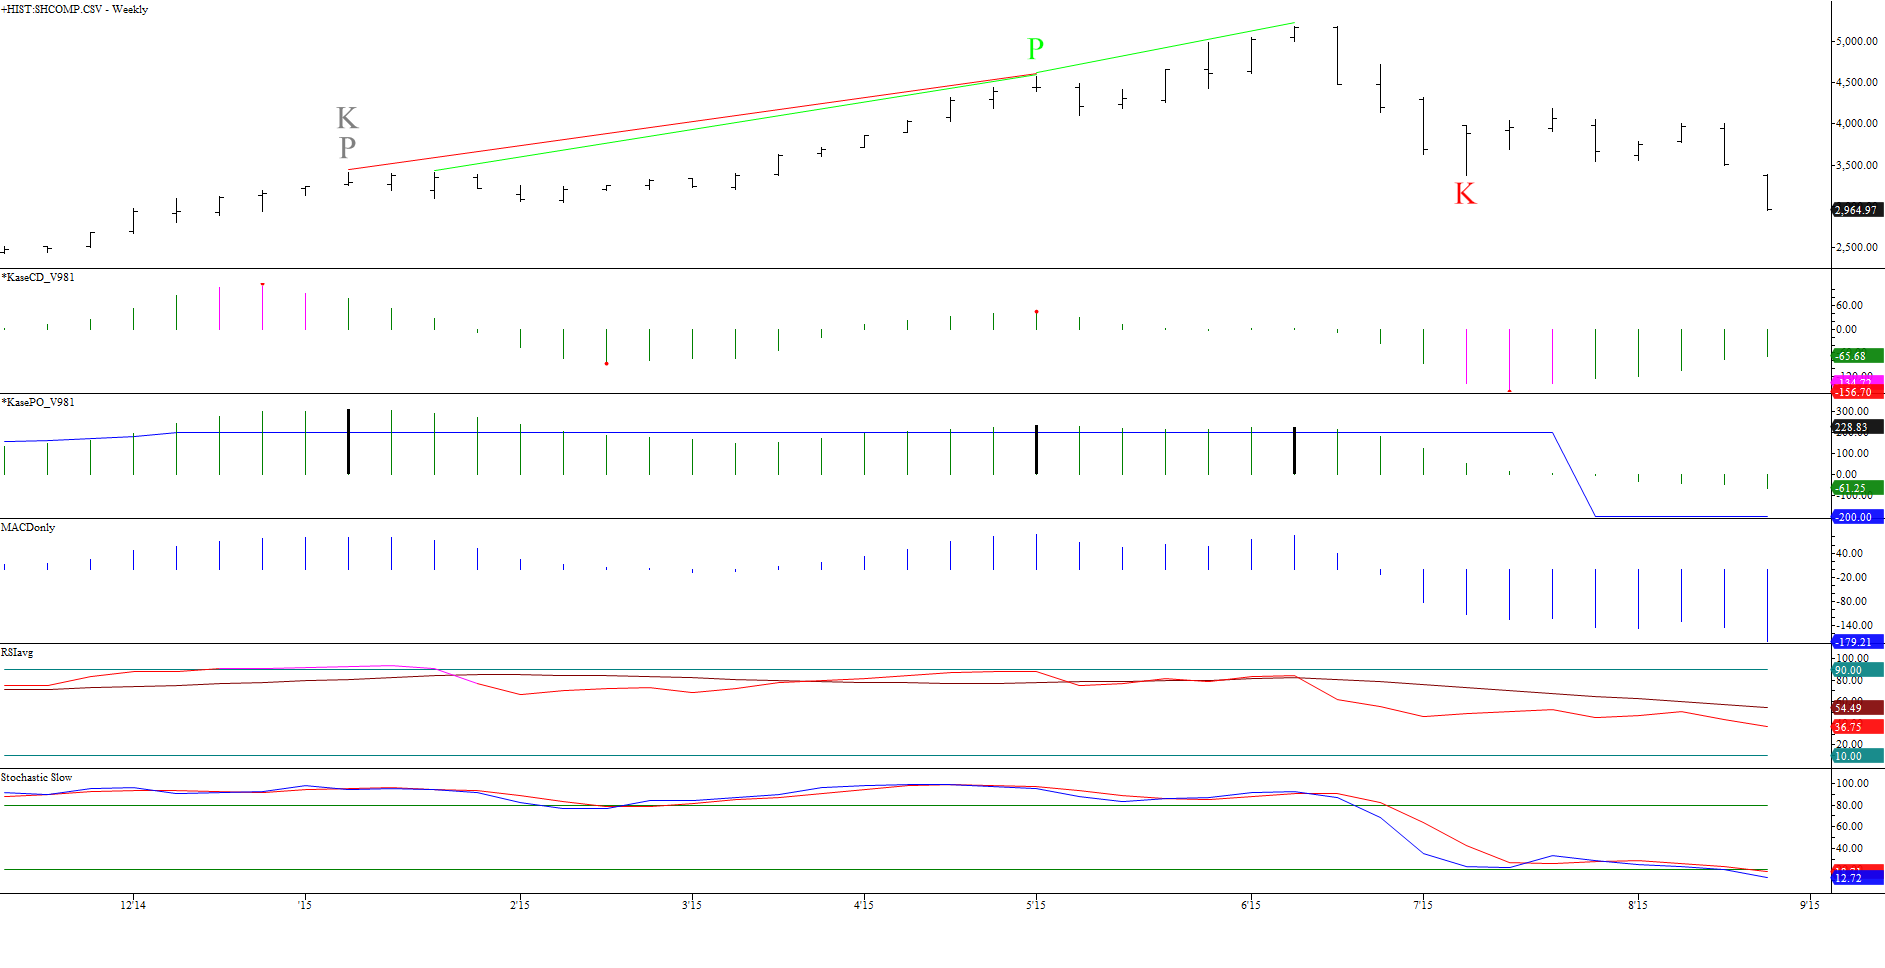
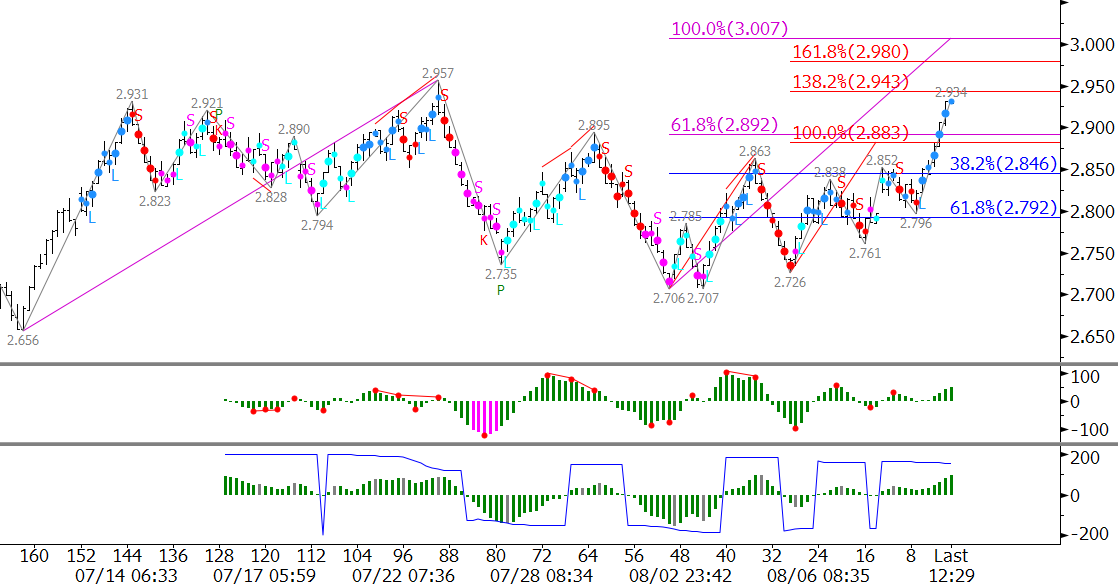
The move up from 93.13 is a zig-zag abc pattern, where wave a equals wave c. Thus the upward correction could be complete having fulfilled a normal objective at 98.15. Also the second leg of the correction took 22 days, much shallower than the first at eight days. Put another way, it took almost three times as long for an equal increase in prices for wave c. The KaseCD momentum indicator exhibited a negative divergence at the July 21, 98.15 swing high.

us dollar chart

Charts created using TradeStation. ©TradeStation Technologies, Inc. 2001-2015. All rights reserved. No investment or trading advice, recommendation or opinions are being given or intended.

For a positive outlook, 95 must hold and resistance at 98.46 overcome, in which case, 100.39 is the target.

Here’s the scoop on 95. The first small wave down from 98.15 projects no lower than 95 as the trend terminus (98.153/97.112), 2*1.38 extension, and the corrective Phi3 projection. 95 is confluent as the daily Kase DevStop6 and weekly warning line.

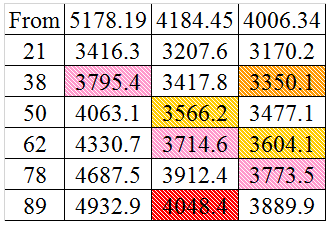
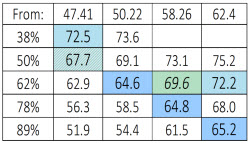
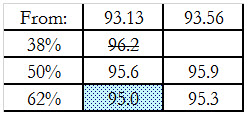
95 is the 62 percent retracement of the entire correction from 93.56, as shown in the table below. (As shown by the strike through, the decline has met the 38 percent retracement.) Finally the wave from April’s 98.46 swing high targets 95 as its minimum extension. So 95 is both a big target and major support. If broken, a decline to 91 becomes probable.

us dollar small

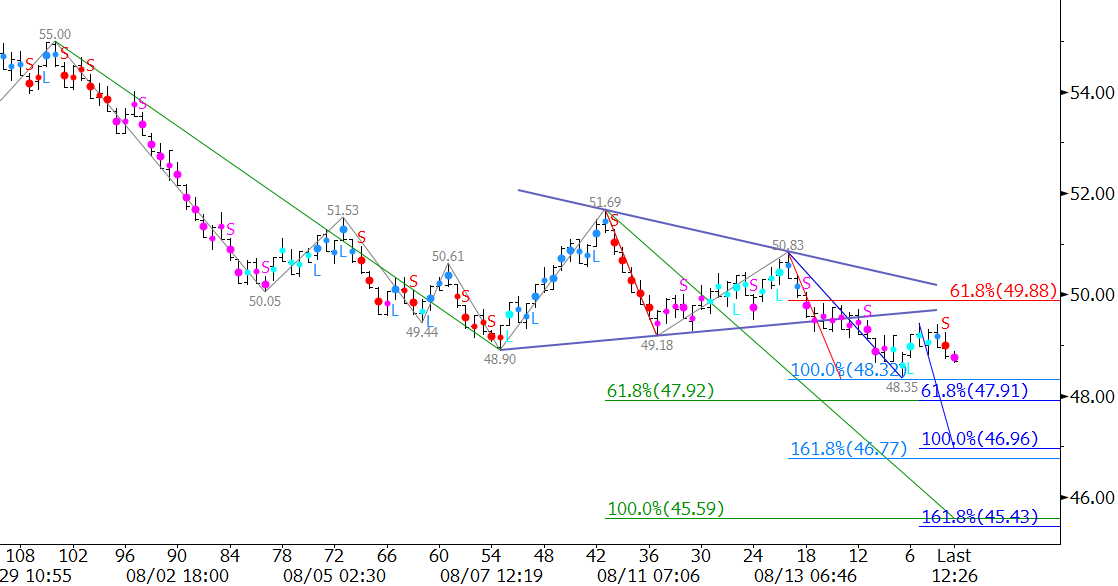
The downward pattern from 98.15, is also a zig-zag with equal waves. That’s supportive, as is the Harami star noted above, along with a bullish divergence on the KaseCD based on a 0.25 Kase Bar intraday chart. As noted, at minimum, 98.46 must be overcome for a recovery to come into view. This is not only the first swing high above 98.15, but also highly confluent for recent up waves. Very importantly it’s the next 1.38 extension for the wave 93.56 – 96.37 – 94.68 that’s already met and extended beyond its 1.0, equal to, objective.

Above 98.4, there’s some resistance at 99, but odds near certainty, then, for 100.39. This is the 1.38 extension (and Phi corrective projection) for wave a of the upward zig-zag pattern, and for the final up wave, 95.45 – 98.15 – 96.29. Above 100.39, the target’s 104.

It’s not yet time to “bet your bottom dollar” on DXY, but to watch the key levels and act accordingly!

“Ask Kase” and your question may be chosen as the subject of a future column (askkase@kaseco.com).