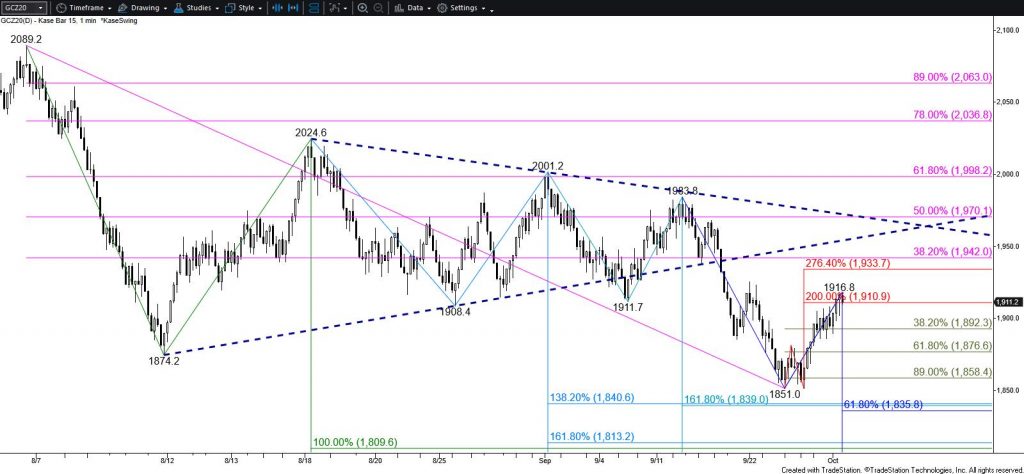
The near-term outlook for gold is bullish after settling above the $1851.0 double bottom’s $1911 target today. The move up is poised to reach $1938. This is the highest the wave up from $1851.0 projects and is in line with the 38 percent retracement of the decline from $2089.2. Gold will likely be hard-pressed to close above $1938 without a test of support first. Therefore, once $1938 is met odds for a significant test of resistance will rise to better than even. Nevertheless, closing above $1938 would warn that the move down from $2089.2 might be complete and would call for $1958 and higher.
Gold – $15 Kase Bar Chart
Should gold turn lower before reaching $1938 look for initial support at $1892 and key near-term support at $1877. Closing below $1877 will shift odds back in favor of challenging $1851 and then $1840.
This is a brief analysis for the next day or so. Our weekly Metals Commentary and daily updates are much more detailed and thorough energy price forecasts that cover key COMEX precious metals futures contracts and LME Non-Ferrous (Base) metals, spot gold, the gold/silver ration, and gold ETFs. If you are interested in learning more, please sign up for a complimentary four-week trial.
Natural Gas Technical Analysis and Near-Term Outlook
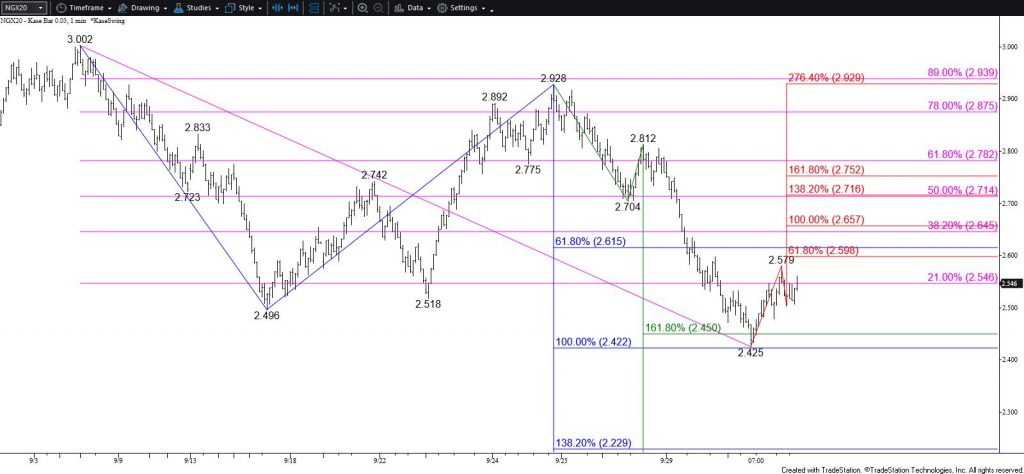
Natural gas held major support at $2.43 and today’s move up implies that a larger test of resistance should take place tomorrow. The move up is still considered to be corrective of the recent decline and must settle above $2.67 to state that the move down might be complete. Natural gas will have to settle above $2.78 to reestablish a firm bullish outlook. Such a move is doubtful without a significant boost from external factors.
Near-term odds favor at least $2.60 and likely $2.67. These are the smaller than (0.618) and equal to (1.00) targets of the primary wave up from $2.425. The $2.67 objective is also near the 38 percent retracement of the decline from $3.002 and is Tuesday’s midpoint. Settling above this would suggest that the move down is complete. However, as stated above, November natural gas will have to settle above $2.78 to confirm a bullish outlook.
Natural Gas – $0.03 Kase Bar Chart
With that said, the overarching bias remains bearish due to Tuesday’s decline and the large seasonal rollover gap on the continuation chart. Even so, $2.43 is major support that could form a bullish base because it is the equal to target of the wave down from $3.002, the 62 percent retracement of the rise from $2.072, and the 200-day moving average. Therefore, while $2.43 holds, near-term odds will continue to favor a larger test of resistance.
Should natural gas take out $2.48 early tomorrow look for another test of $2.43. Settling below this will call for a much more significant move down before stalling again.
This is a brief analysis for the next day or so. Our weekly Natural Gas Commentary and daily updates are much more detailed and thorough energy price forecasts that cover key natural gas futures contracts, calendar spreads, the UNG ETF, and several electricity contracts. If you are interested in learning more, please sign up for a complimentary four-week trial.
WTI Crude Oil Technical Analysis and Short-Term Forecast
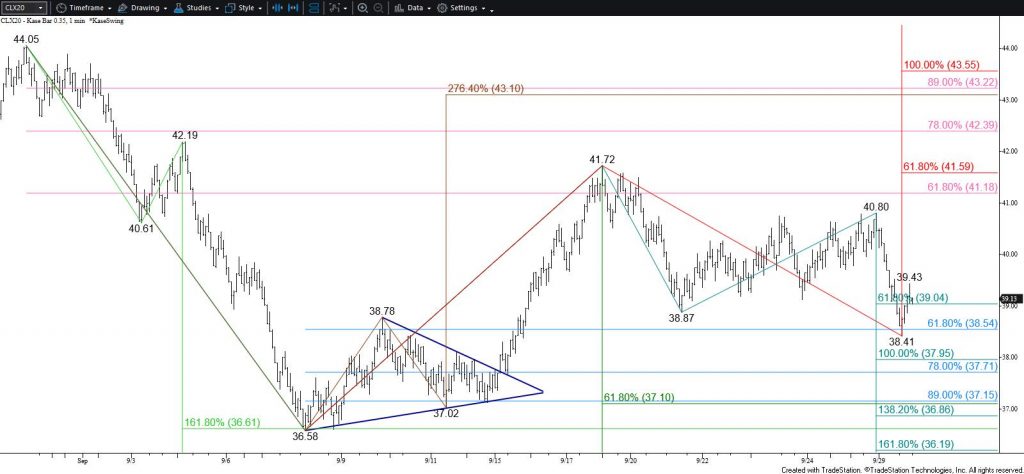
WTI crude oil’s move up from $38.87 stalled short of the $41.1 objective and finally proved to be corrective of the decline from $41.72. WTI took out the $39.0 smaller than (0.618) target of the primary wave down from $41.72 and stalled marginally below the 62 percent retracement of the rise from $36.58. The move down might become a grind during the next few days, but odds favor a test of the $38.0 equal to (1.00) target. Closing below this would then call for the key objective at $37.1. This is the smaller than (0.618) target of the bigger wave down from $44.05. Settling below $37.1 would clear the way for much lower prices and a much more bearish outlook in the coming weeks.
WTI Crude Oil – $0.35 Kase Bar Chart
Nevertheless, because the move down stalled at the 62 percent retracement of the rise from $36.58 and $39.0 held on a closing basis there is a modest chance for a larger test of resistance early tomorrow. Initial resistance at $39.7 is expected to hold and key resistance is $40.5. Settling above $40.5 would shift near-term odds back in favor of making a push toward $41.6. This is the smaller than target of the wave up from $36.58 and the barrier for renewed a bullish outlook.
Brent Crude Oil Technical Analysis and Short-Term Forecast
Brent settled below the 62 percent retracement of the rise from $39.88, confirmed the $43.07/$43.03 pseudo double top, and took out the smaller than (0.618) target of the primary wave down from $44.30. Brent is now poised to extend to $40.3, a close below which will call for a test of key support and the barrier to a much more bearish outlook in the coming weeks at $39.9.
With that said, the larger than (1.618) target of the wave down from $43.07 held today. Therefore, there is a modest chance for a test of $42.2 before taking out $40.9. Key near-term resistance is $43.0. Closing above this will call for a test of $43.6, which then connects to $45.3 and higher.
This is a brief analysis for the next day or so. Our weekly Crude Oil Forecast and daily updates are much more detailed and thorough energy price forecasts that cover WTI, Brent, RBOB Gasoline, Diesel, and spreads. If you are interested in learning more, please sign up for a complimentary four-week trial.
Gold Technical Analysis and Near-Term Outlook
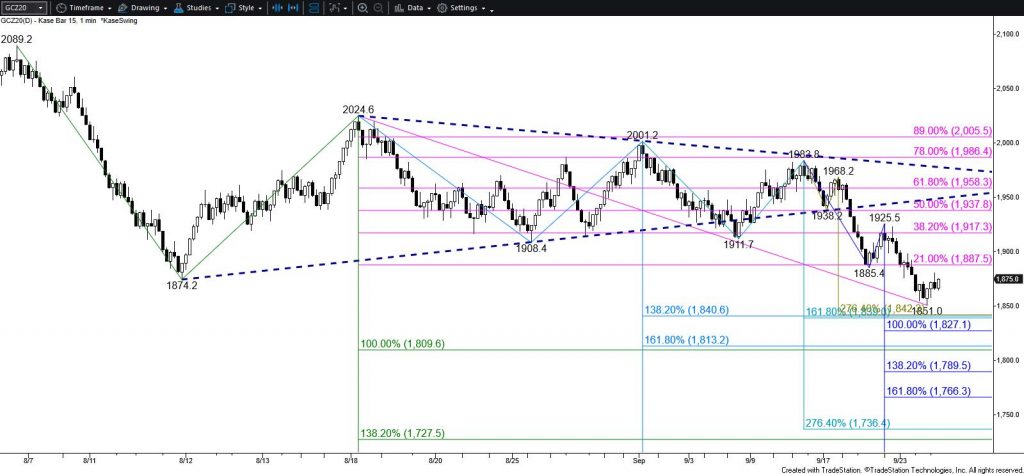
The outlook for December COMEX gold is bearish after breaking lower out of a coil pattern last week and settling below a crucial $1888 objective on Wednesday. The sustained close below $1888, the smaller than (0.618) target of the primary wave down from $2089.2, calls for gold to reach the $1810 equal to (1.00) target in the coming days.
Gold – $15 Kase Bar Chart
However, there is strong near-term support around $1843. This is the most confluent wave projection and is in line with the 38 percent retracement of the move up from $1458.8. Today’s formation of a hammer also suggests that a larger test of resistance might take place before the decline continues.
The $1888 level has become initial resistance and will likely hold. However, the increase in volatility during the past few days could help drive gold to challenge $1905. These are the completion and confirmation points for today’s hammer pattern, respectively. Settling above $1905 is doubtful but would dampen odds for a continued decline during the next few days and would shift near-term odds in favor of challenging $1930 and possibly $1954.
This is a brief analysis for the next day or so. Our weekly Metals Commentary and daily updates are much more detailed and thorough energy price forecasts that cover key COMEX precious metals futures contracts and LME Non-Ferrous (Base) metals, spot gold, the gold/silver ration, and gold ETFs. If you are interested in learning more, please sign up for a complimentary four-week trial.
Natural Gas Technical Analysis and Near-Term Outlook
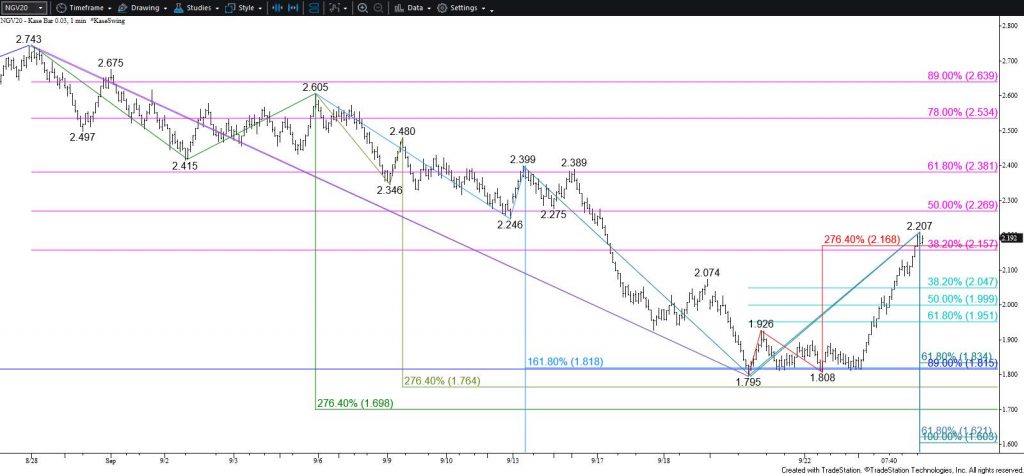
October natural gas finally rallied after holding support around $1.82. The prompt month’s move up should be bolstered by rising winter prices and a bullish shift in near-term external factors.
October settled below $2.16, the 38 percent retracement of the decline from $2.743 and the XC (2.764) projection. This objective was also in line with October’s 100- and 200-day moving averages. Nevertheless, the post-settlement rise to $2.207 implies that near-term sentiment remains bullish headed into tomorrow.
Natural Gas – $0.03 Kase Bar Chart
The next major objectives for October natural gas are $2.27 and $2.38. The $2.27 target is the 50 percent retracement from $2.743 and 50-day moving average. The $2.38 target is the 62 percent retracement. Settling above $2.38 will call for $2.44, the smaller than (0.618) target of the wave up from $1.70 that connects to $2.84 and higher.
The challenge for tomorrow is that the wave formation up from $1.795 does not project any higher than $2.22. This is the trend terminus for that wave and the move up from $1.808 lacks a clear wave structure. Therefore, there is a good chance for a test of support before prices rise much higher.
There is immediate support at $2.11 but given the increase in volatility, a test of $2.05 is probable. Key support is $1.99. This is the 50 percent retracement of the rise from $1.795 and today’s midpoint. Closing below $1.99 would call for $1.95 and $1.84, the latter of which is the barrier to an unlikely bearish outlook in the coming weeks.
This is a brief analysis for the next day or so. Our weekly Natural Gas Commentary and daily updates are much more detailed and thorough energy price forecasts that cover key natural gas futures contracts, calendar spreads, the UNG ETF, and several electricity contracts. If you are interested in learning more, please sign up for a complimentary four-week trial.
WTI Crude Oil Technical Analysis and Short-Term Forecast
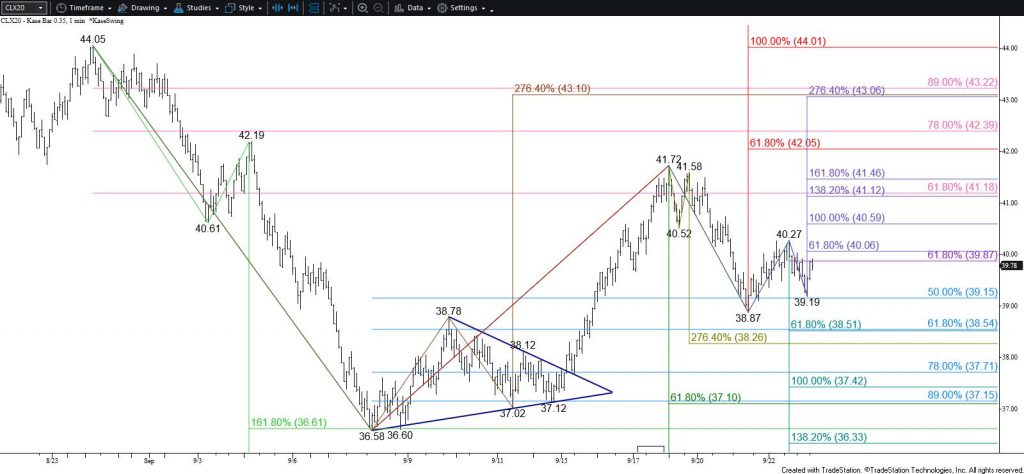
The near-term outlook for November WTI crude oil leans bullish after holding the 100-day moving average for the second straight day and holding the 50 percent retracement of the rise from $36.58 on a closing basis. This is a tight call though, and today’s long-legged doji reflects uncertainty headed into tomorrow.
Nevertheless, the wave formation up from $38.87 is poised to test its $40.1 smaller than (0.618) target. This then connects to a key objective at $40.6 as the equal to (1.00) target. The $40.6 objective is also the 62 percent retracement of the decline from $41.72. Settling above $40.6 will clear the way for $41.2 and then $42.1. The $42.1 objective is most important because this is the smaller than target of the primary wave up from $36.58. Settling above $42.1 will put odds firmly in favor of higher prices.
WTI Crude Oil – $0.35 Kase Bar Chart
With that said, the late move up from $39.19 stalled near the 62 percent retracement of the decline from $40.27. Also, the choppy nature of today’s move up from $38.87 implies that today’s price action might be corrective of the move down from $41.72. Should WTI fall below $39.1, look for a test of crucial support at $38.5. This is the smaller than target of the primary wave down from $41.72 and the 62 percent retracement of the rise from $36.58. Settling below this will significantly dampen odds for a continued rise and would call for key near-term support at $37.2. This is in line with the smaller than target of the primary wave down from $44.05. Settling below $37.2 would confirm a bearish outlook for WTI in the coming weeks.
Brent Crude Oil Technical Analysis and Short-Term Forecast
Brent crude oil settled below the 100-day moving average for the second straight day. This was bearish for the outlook, but today’s long-legged doji reflects uncertainty after Monday’s decline. Also, the 62 percent retracement of the rise from $39.3 at $41.0 has held and the wave up from $40.96 is poised to challenge its $42.0 smaller than (0.618) target. Rising above this will call for $42.5, which then connects to $43.2 and higher.
Conversely, the move up from $40.96 has been rather choppy and may prove to be a correction. Should Brent take out $41.0 look for a test of $40.3. Settling below $40.3 would call for another test of key support and the barrier to a longer-term bearish outlook at $39.3.
This is a brief analysis for the next day or so. Our weekly Crude Oil Forecast and daily updates are much more detailed and thorough energy price forecasts that cover WTI, Brent, RBOB Gasoline, Diesel, and spreads. If you are interested in learning more, please sign up for a complimentary four-week trial.
Gold Technical Analysis and Near-Term Outlook
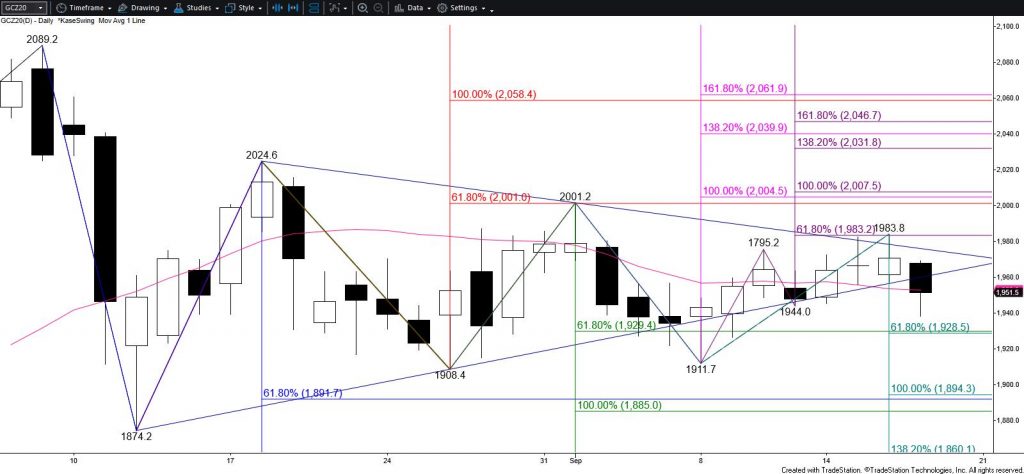
The near-term outlook for gold is bearish after finally breaking lower out of a coil pattern and settling below the pattern’s lower trend line. Gold also settled below the 20-day moving average. The move down is now poised to reach at least $1929. This is the smaller than (0.618) target of the wave down from $2001.2 and connects to a key objective at $1892 as the equal to (1.00) target. The $1892 objective is also the smaller than target of the primary wave down from $2089.2. Settling below this would be quite bearish for the outlook in the coming weeks.
Gold – Daily Coil
Nevertheless, a move up at the end of the day suggests gold might test the lower trend line of the coil before the decline continues. Tomorrow, this trend line will intersect with $1964 resistance and is expected to hold. Rising above this would call for another attempt at $1983, the smaller than target of the wave up from $1911.7. Settling above $1983 would imply that today’s move down was another false breakout and would clear the way for $2005 and likely higher.
This is a brief analysis for the next day or so. Our weekly Metals Commentary and daily updates are much more detailed and thorough energy price forecasts that cover key COMEX precious metals futures contracts and LME Non-Ferrous (Base) metals, spot gold, the gold/silver ration, and gold ETFs. If you are interested in learning more, please sign up for a complimentary four-week trial.
Natural Gas Technical Analysis and Near-Term Outlook
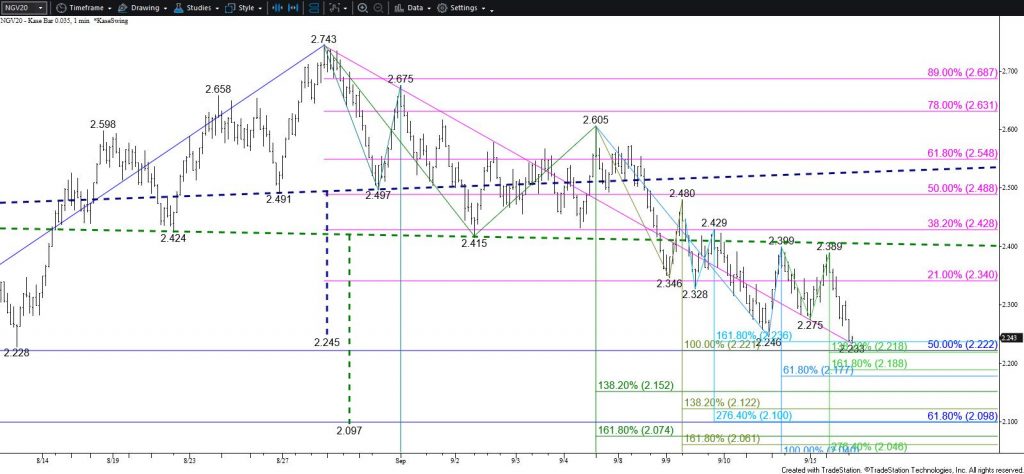
The near-term outlook for natural gas has shifted back to being firmly bearish. Yesterday’s move up proved to be another pullback to challenge the neckline of the complex head and shoulders. Also, natural gas settled below the crucial $2.28 objective and fell toward another important target at $2.22 after the settlement.
The $2.22 target is the 50 percent retracement of the rise from $1.700 and a confluent wave projection. There is also a target at $2.19 that has increased in importance during the past few days. This area between $2.19 and $2.22 may prove to be a stalling point. Even so, any move up from this area will most likely prove to be a short-lived correction and is expected to hold $2.31.
Natural Gas – $0.035 Kase Bar Chart
Now that natural gas has taken out the $2.28 equal to (1.00) target the primary wave down from $2.743, the decline is poised to extend to the $2.15 intermediate (1.382) target and then the $2.10 larger than (1.618) target. The $2.10 target is crucial and is the most likely stalling point for the decline from $2.743 because this is also the 62 percent retracement of the move up from $1.700 and the complex head and shoulders’ target.
The 50-day moving average held on a closing basis today, but prices have already moved below that level after the settlement. Otherwise, there are no signals or patterns that call for the move down to end. As stated earlier, resistance at $2.31 is expected to hold and $2.35 is key for the near-term. Settling above $2.35 will call for another attempt at $2.43 and higher.
This is a brief analysis for the next day or so. Our weekly Natural Gas Commentary and daily updates are much more detailed and thorough energy price forecasts that cover key natural gas futures contracts, calendar spreads, the UNG ETF, and several electricity contracts. If you are interested in learning more, please sign up for a complimentary four-week trial.
WTI Crude Oil Technical Analysis and Short-Term Forecast
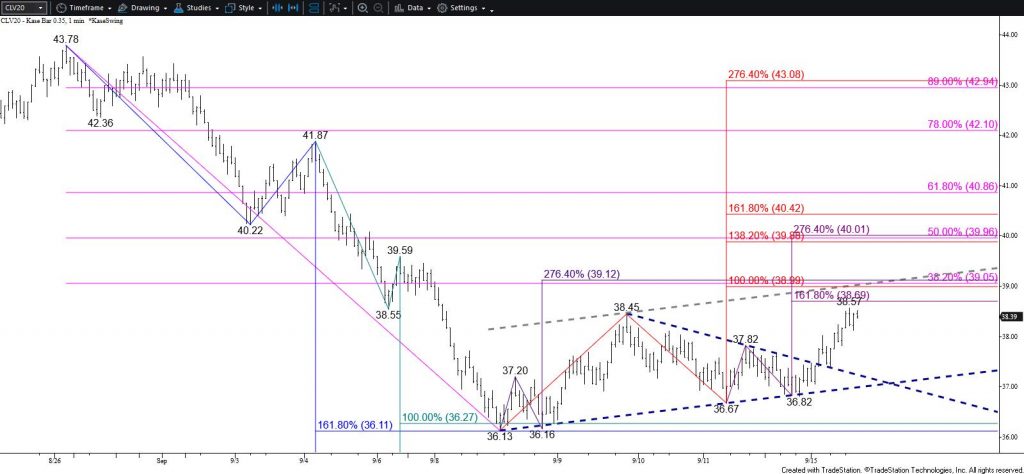
WTI crude oil broke higher out of an intra-day coil pattern (dark blue dotted lines) and settled the day above the $38.1 smaller than (0.618) target of the primary wave up from $36.13 (red). The $38.1 level was also the midpoint of the September 8 candlestick. This was positive for the near-term outlook and calls for a test of $39.0 tomorrow. However, $39.0 will likely hold.
The $39.0 objective is extremely important for the near-term outlook because it is the equal to (1.00) target of the primary wave up from $36.13 (red) and the 38 percent retracement of the decline from $43.78 (pink). Settling above this would warn that the recent move down might already be complete and would call for a test of $40.0 and higher.
WTI Crude Oil – $0.35 Kase Bar Chart
Nevertheless, aside from today’s move up, the rise from $36.13 has been extremely shallow and choppy. Therefore, this move is most likely corrective. Additionally, the move up from $36.13 could form a bearish flag pattern if $39.0 holds. This is because a trend line parallel to the lower trend line of the coil (gray dotted line) will intersect with $39.0 tomorrow.
Once $39.0 is met, odds for a test of $37.6 will increase. Holding $39.0 and settling below $37.6 will confirm that a flag is forming and will call for a test of $37.1. This is currently the 62 percent retracement of the rise from $36.13 and is in line with the potential flag’s lower trend line. Settling below $37.1 will call for another test of $36.0.
Granted, $36.0 was and still is, major support for the longer-term outlook. Therefore, the move down might be complete. However, the fate of WTI’s near-term outlook will be determined by holding or closing above $39.0 tomorrow.
Brent Crude Oil Technical Analysis and Short-Term Forecast
Brent formed a double bottom around $39.3 that will be confirmed by a close above the $41.20 swing high. The target of the double bottom is $43.1. Based on the waves up from $39.30, Brent should rise to $41.3 tomorrow. However, an immediate close above this (and the $41.20 swing high) will likely be a challenge because $41.3 is the 100-day moving average.
Once $41.3 is met, odds for a test of $39.9 will rise. Settling below $39.9 would imply that a rectangle pattern is forming instead of a double bottom. This pattern would be bearish for the outlook rather than bullish. In this case, odds would shift in favor of testing $39.3, a close below which would call for the move down from $46.61 to continue.
This is a brief analysis for the next day or so. Our weekly Crude Oil Forecast and daily updates are much more detailed and thorough energy price forecasts that cover WTI, Brent, RBOB Gasoline, Diesel, and spreads. If you are interested in learning more, please sign up for a complimentary four-week trial.
Gold Technical Analysis and Near-Term Outlook
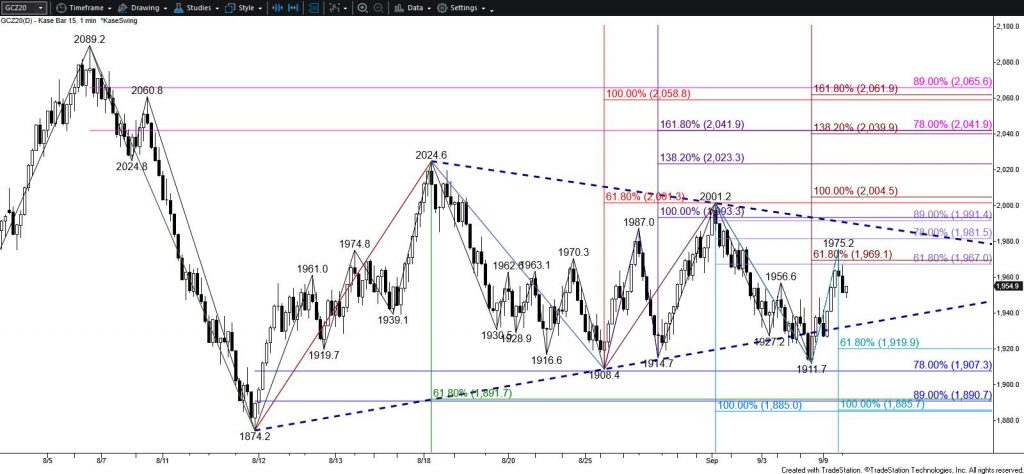
Gold is trading in a narrowing range that forms a coil pattern. Coils are not exceptionally reliable patterns like flags and pennants when it comes to determining a breakout direction. However, they lean in favor of a breakout in the direction of the prior move before the coil formed, in this case, down. A breakout of the coil should take place during the next few days.
Coils reflect uncertainty, which makes this is a very tight near-term call for gold right now. Even so, odds continue to lean in favor of a break lower. Falling below $1936 will call for $1820. This is the smaller than target of the wave down from $2001.2. Settling below this will confirm a break lower out of the coil and call for a test of $1888 and likely lower.
Gold – Coil on $15 Kase Bar Chart
Nevertheless, gold briefly broke the coil’s lower trend line on Tuesday, but since then has challenged the 62 percent retracement of the decline from $2001.2 and the smaller than (0.618) target of the wave up from $1908.4. Prices also settled above the 20-day moving average today. These factors suggest the coil’s upper trend line around $1988 might be challenged before another test of support. Also, the wave up from $1908.4 calls for a test of $2002. Settling above $2002 would confirm a break higher out of the coil and clear the way for $2023 and likely $2041.
This is a brief analysis for the next day or so. Our weekly Metals Commentary and daily updates are much more detailed and thorough energy price forecasts that cover key COMEX precious metals futures contracts and LME Non-Ferrous (Base) metals, spot gold, the gold/silver ration, and gold ETFs. If you are interested in learning more, please sign up for a complimentary four-week trial