Natural Gas Technical Analysis and Near-Term Outlook
This is a brief analysis for the next day or so. Our weekly Natural Gas Commentary and daily updates are much more detailed and thorough energy price forecasts that cover key natural gas futures contracts, calendar spreads, the UNG ETF, and several electricity contracts. If you are interested in learning more, please sign up for a complimentary four-week trial.
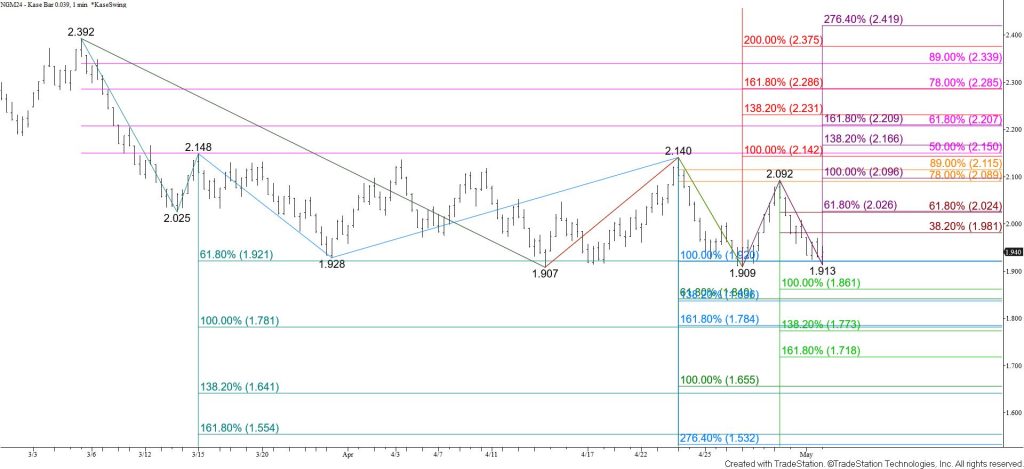
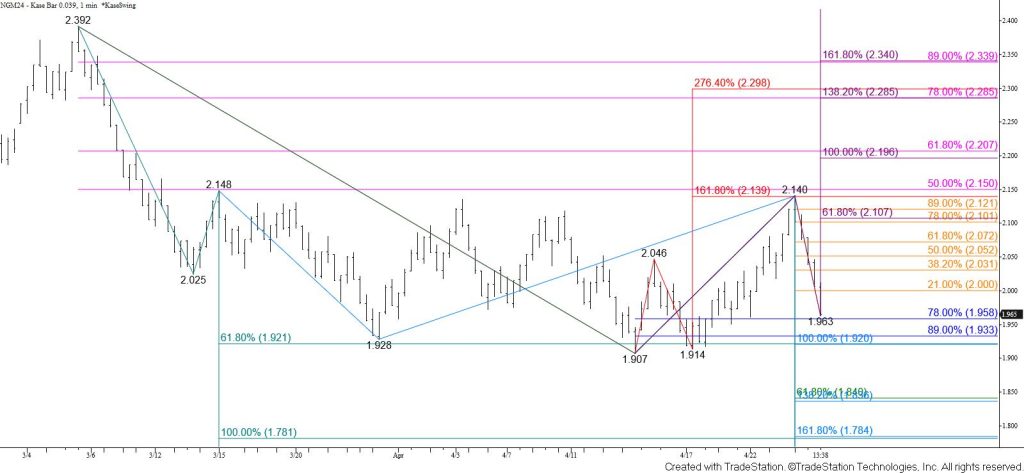
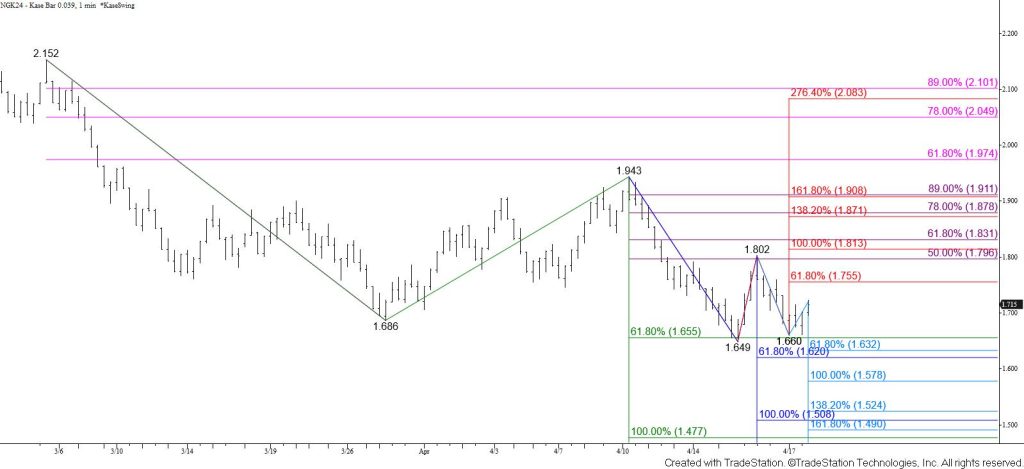
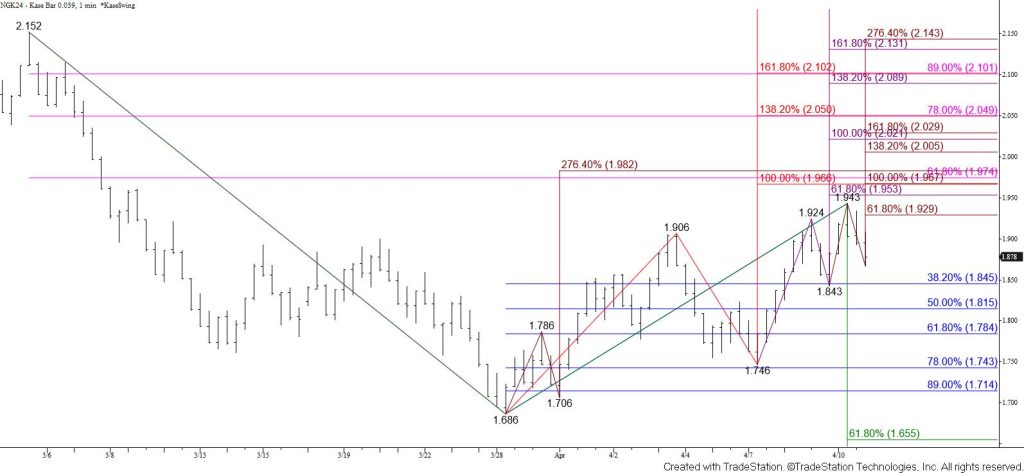
June natural gas tested and held the lower threshold of a trading range between $1.91 and $2.14 again today. A rectangle pattern has formed, and prices are poised to break lower out of the pattern based upon today’s decline to $1.913. Wave projections at $1.92 have held on a closing basis, but prices settled below the smaller than (0.618) target of the most recent wave down from $2.14 today. This wave calls for a test of its $1.86 equal to (1.00) target. Closing below this will confirm a break lower and open the way for tests of confluent objectives at $1.84 and $1.78 in the coming days.
Nevertheless, this is still a somewhat tight call because holding the lower threshold of the rectangle warns that there is a reasonable chance for another test of resistance within the pattern. Should prices rise above $1.98 look for a test of key near-term resistance at $2.03. Closing above this would shift the near-term odds in favor of natural gas rising to challenge $2.10 and possibly the upper threshold of the rectangle at $2.14 again.