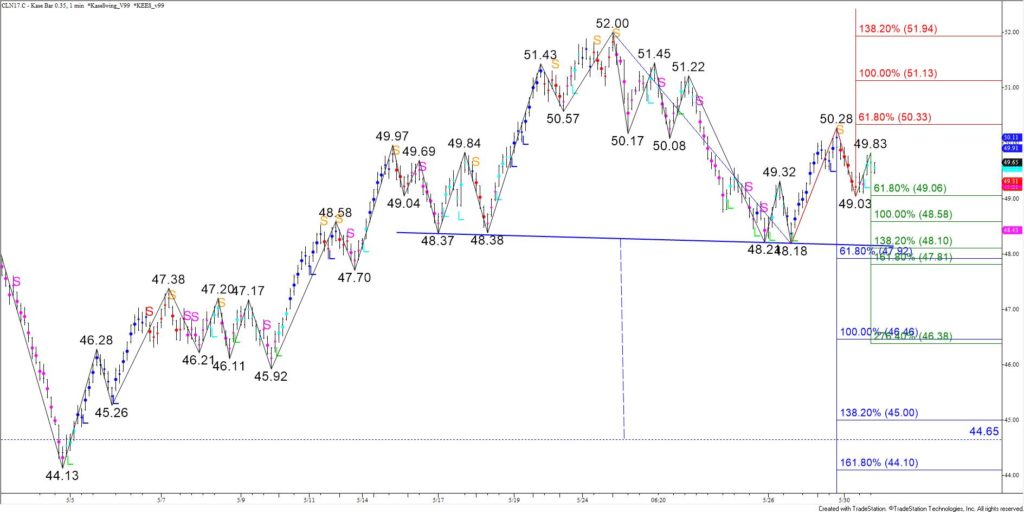
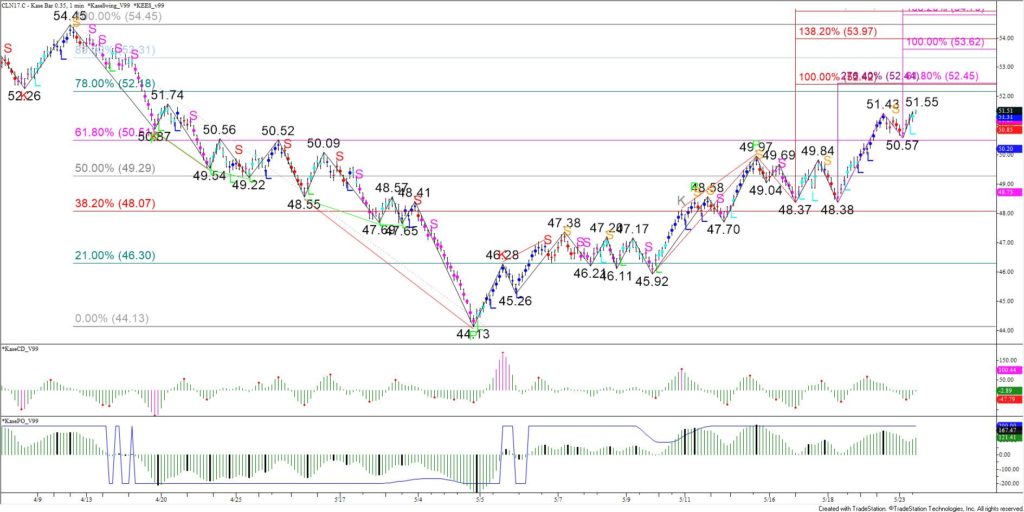
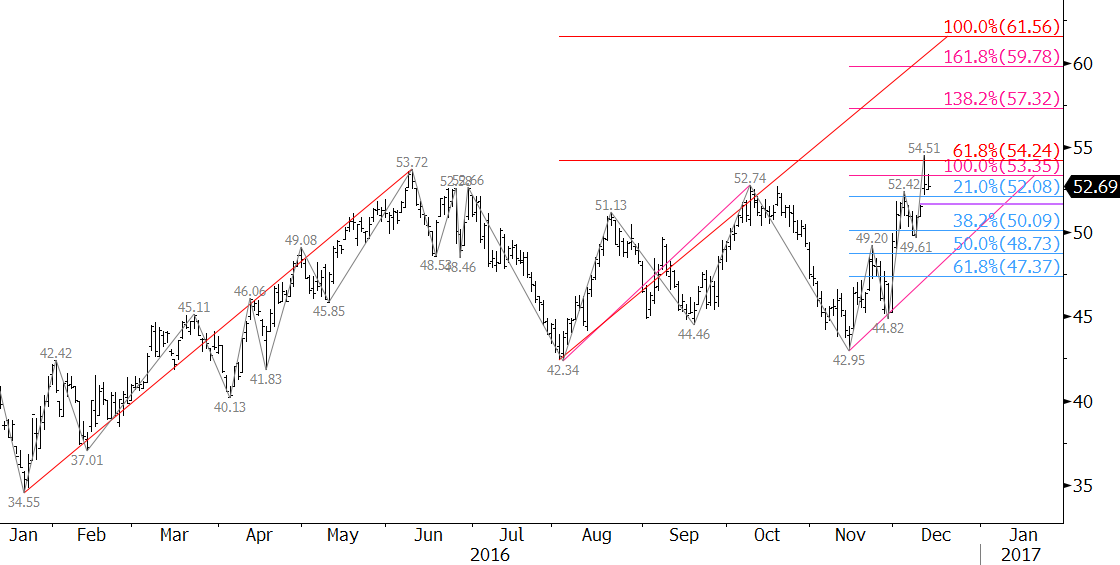
WTI crude oil has formed strong resistance between $50.82 and $50.88. This level has been challenged three times over the past few days and held. One might argue that this is a triple top. However, the decline from $50.88 has been extremely shallow and choppy indicating it is most likely corrective.
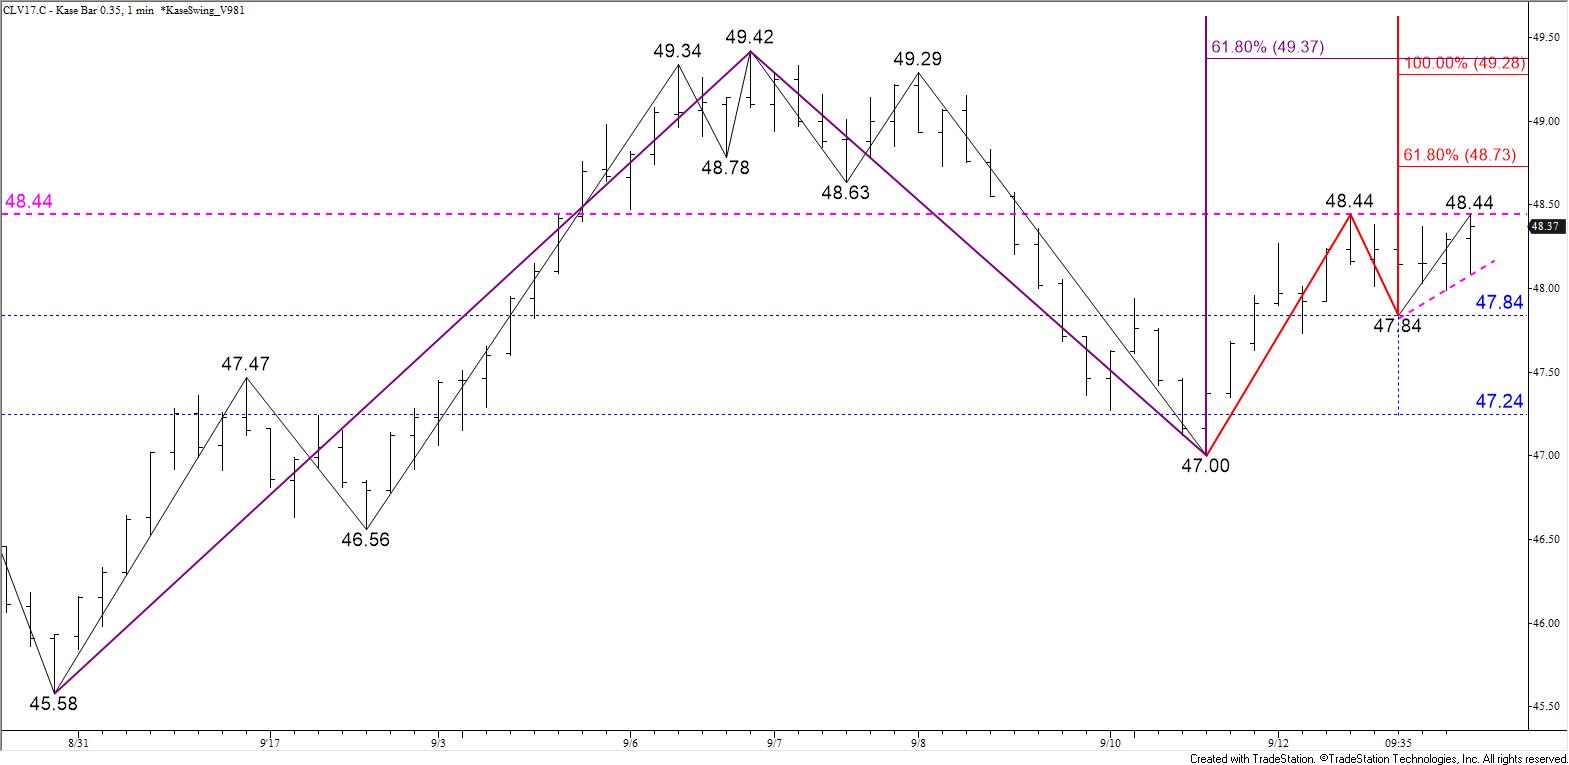
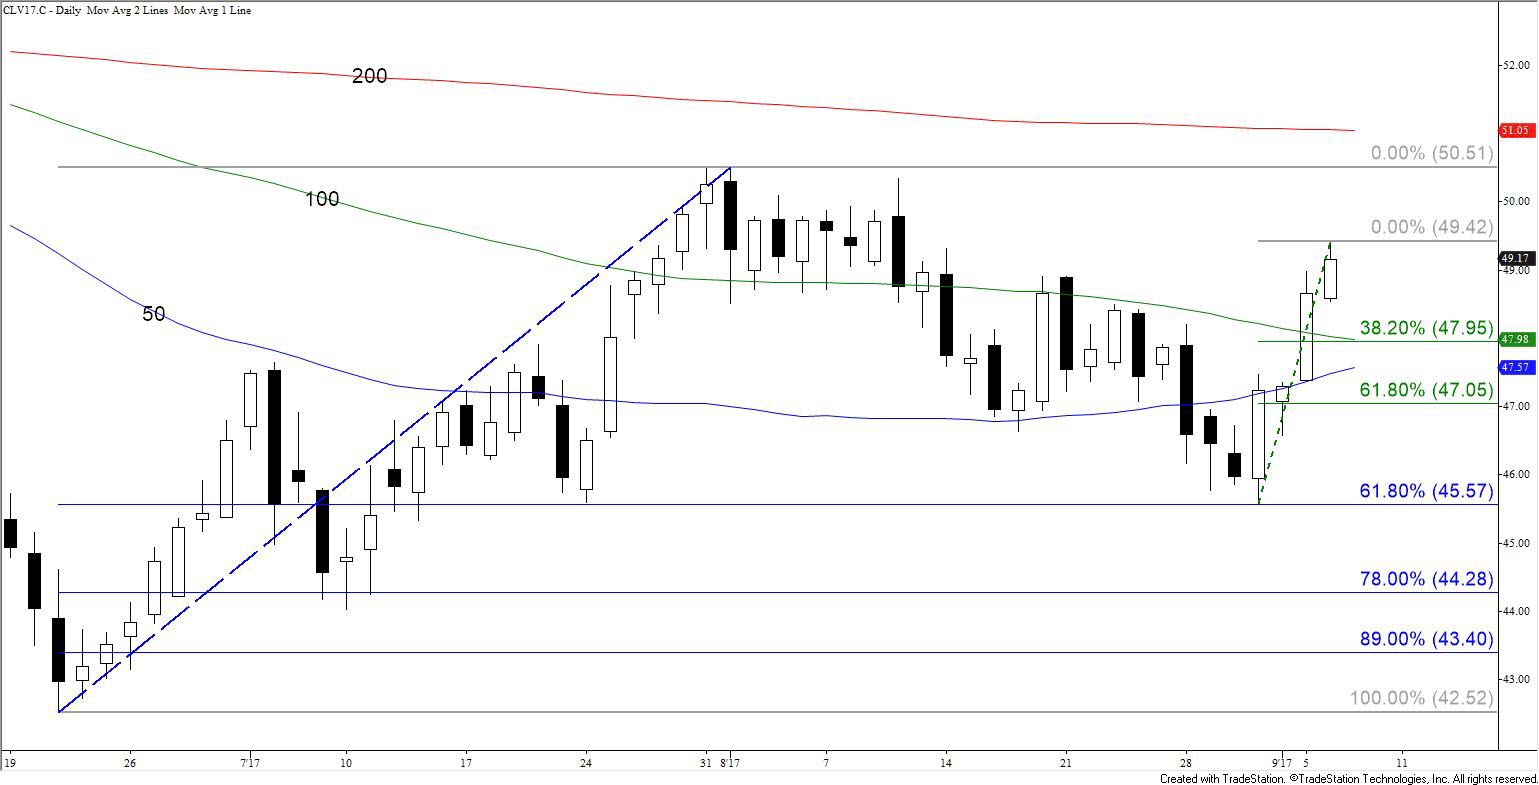
This afternoon’s move up from the $49.73 swing low calls for another attempt at $50.9 early tomorrow. A move above this would call for $51.3, a confluent wave projection that sits just above the 200-day moving average. The confluence and importance of $51.3 make it another potential stalling point. A close over $51.3 would call for $51.7 and $52.5.
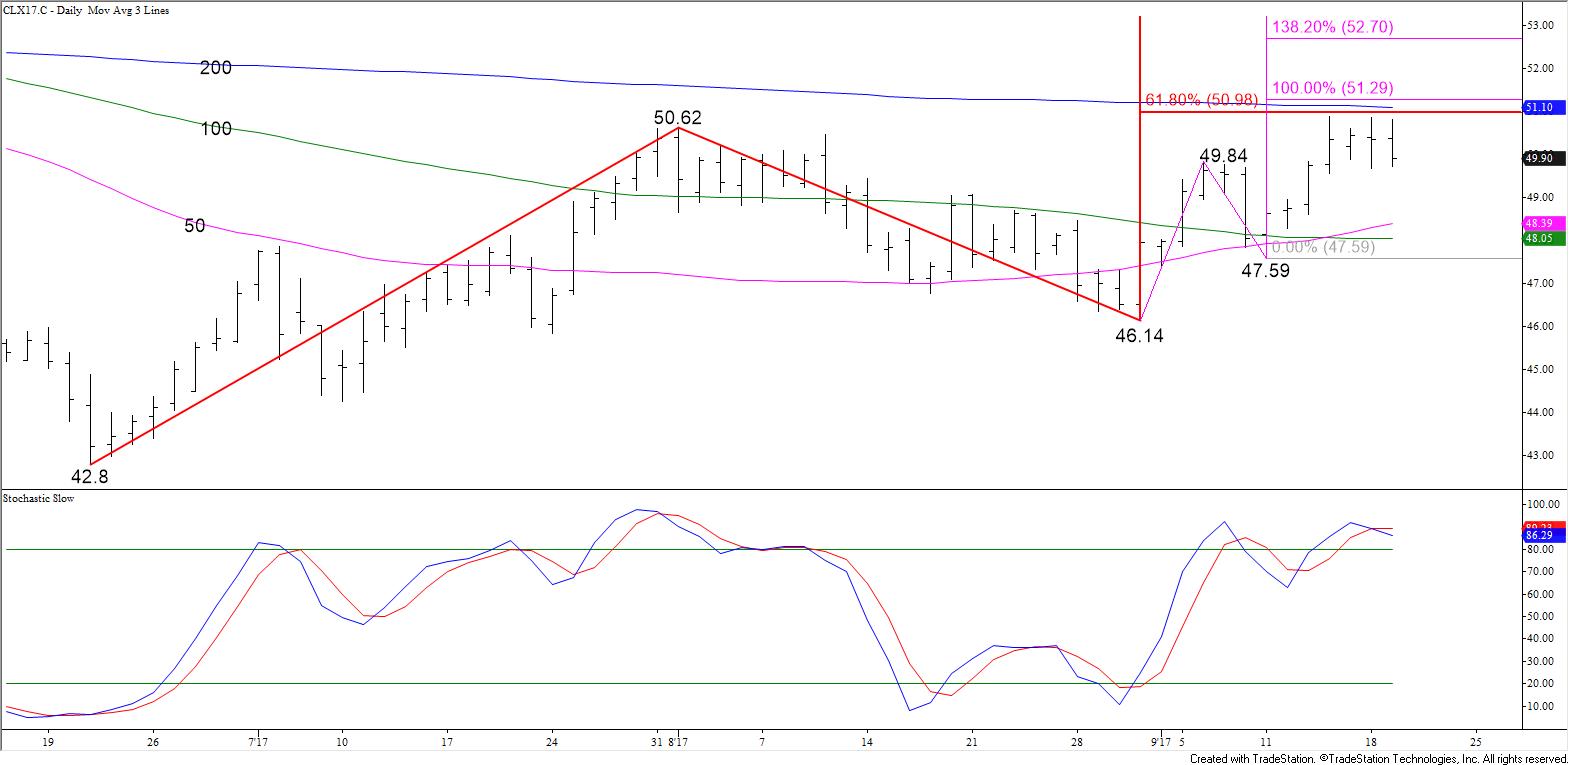
That said, the daily Stochastic is overbought and the move up seems to be exhausted. Should prices fall below $49.6 before rising above $50.9, look for an extended correction to $48.9 and possibly lower before the move up continues to $51.3.
This is a brief analysis for the next day or so. Our weekly Crude Oil Commentary and daily updates are much more detailed and thorough energy price forecasts that cover WTI, Brent, RBOB Gasoline, Diesel, and spreads. If you are interested in learning more, please sign up for a complimentary four-week trial.