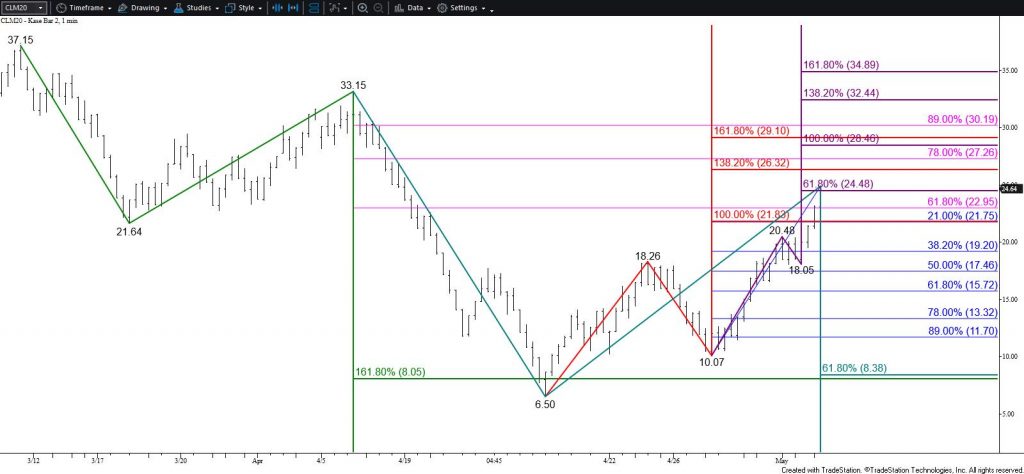
WTI Crude Oil Price Forecast
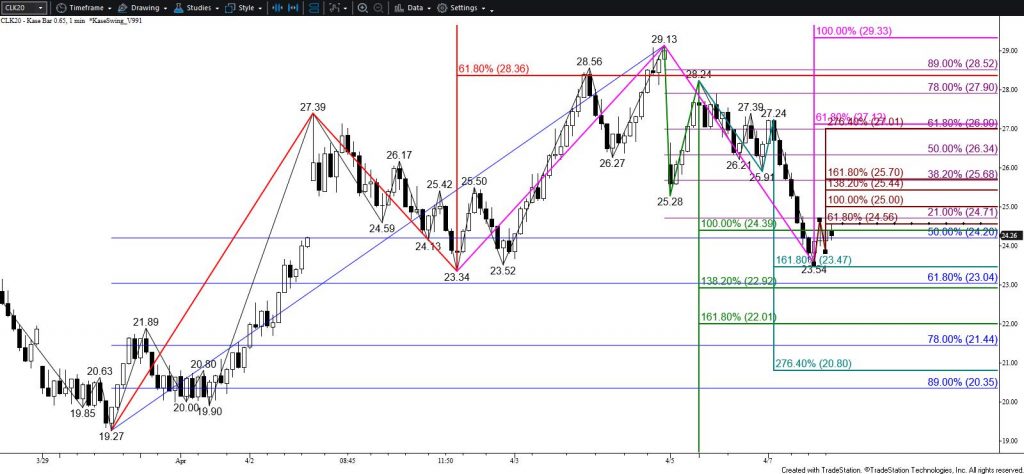
The long-term outlook for crude oil remains bullish. However, the move up is due for a significant test of support before rising much higher. During the past couple of days, a few bearish signals have been confirmed that suggest a larger test of support may be underway.
Today’s initial move down tested and held the 100-day moving average. The subsequent move up was aggressive, especially just before the settlement, but held the 62 percent retracement of the decline from $40.44 and the intermediate (1.382) target of the intra-day wave up from $37.07. WTI pulled back a bit this afternoon, which suggests a test of at least $37.9 will take place early tomorrow. Closing below this would then call for $37.0, the smaller than (0.618) target of the primary wave down from $40.44. Closing below $37.0 will clear the way for $35.7 and possibly lower during the next few days.
Nevertheless, the move up has been resilient, so this is a tight call for the near-term. Should WTI rise above $39.7 before taking out $37.0 look for the move up to extend to $40.6 and then the next major objective and potential stalling point at $41.8.
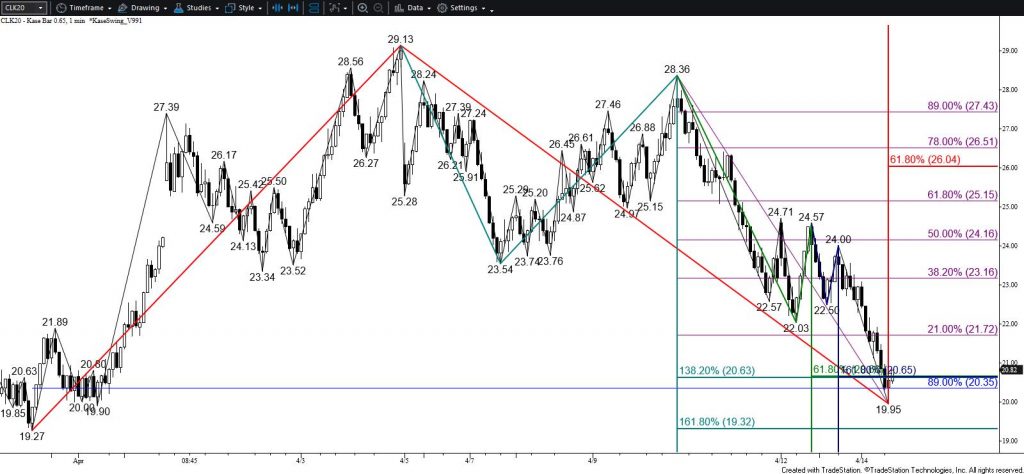
Brent Crude Oil Price Forecast
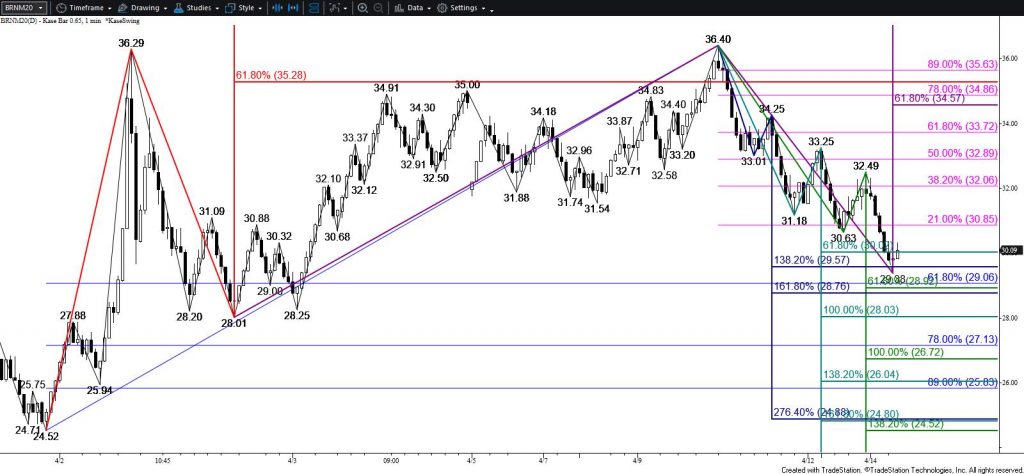
Brent crude oil’s near-term outlook is a bit more bearish than that of WTI. This afternoon’s move up stalled near the 38 percent retracement of the decline from $43.41 and the subsequent move down is already approaching $40.0 again. Falling below $40.0 will call for a test of $39.0, which then connects to $37.7 and lower.
Today’s long lower shadow suggests a larger test of resistance might take place, but $42.1 is expected to hold. Rising above this will call for $42.8 and then $43.7 and higher.
This is a brief analysis for the next day or so. Our weekly Crude Oil Forecast and daily updates are much more detailed and thorough energy price forecasts that cover WTI, Brent, RBOB Gasoline, Diesel, and spreads. If you are interested in learning more, please sign up for a complimentary four-week trial