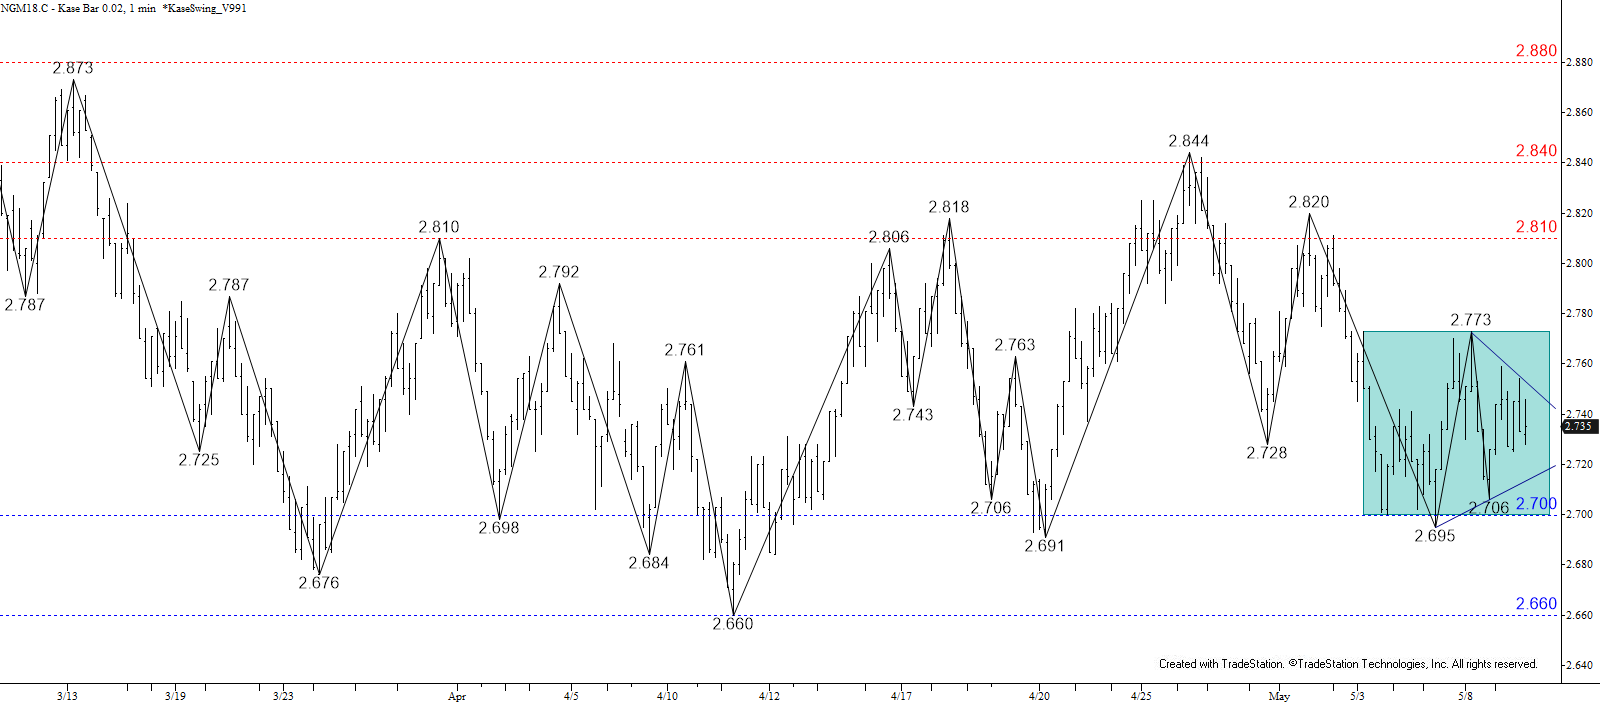
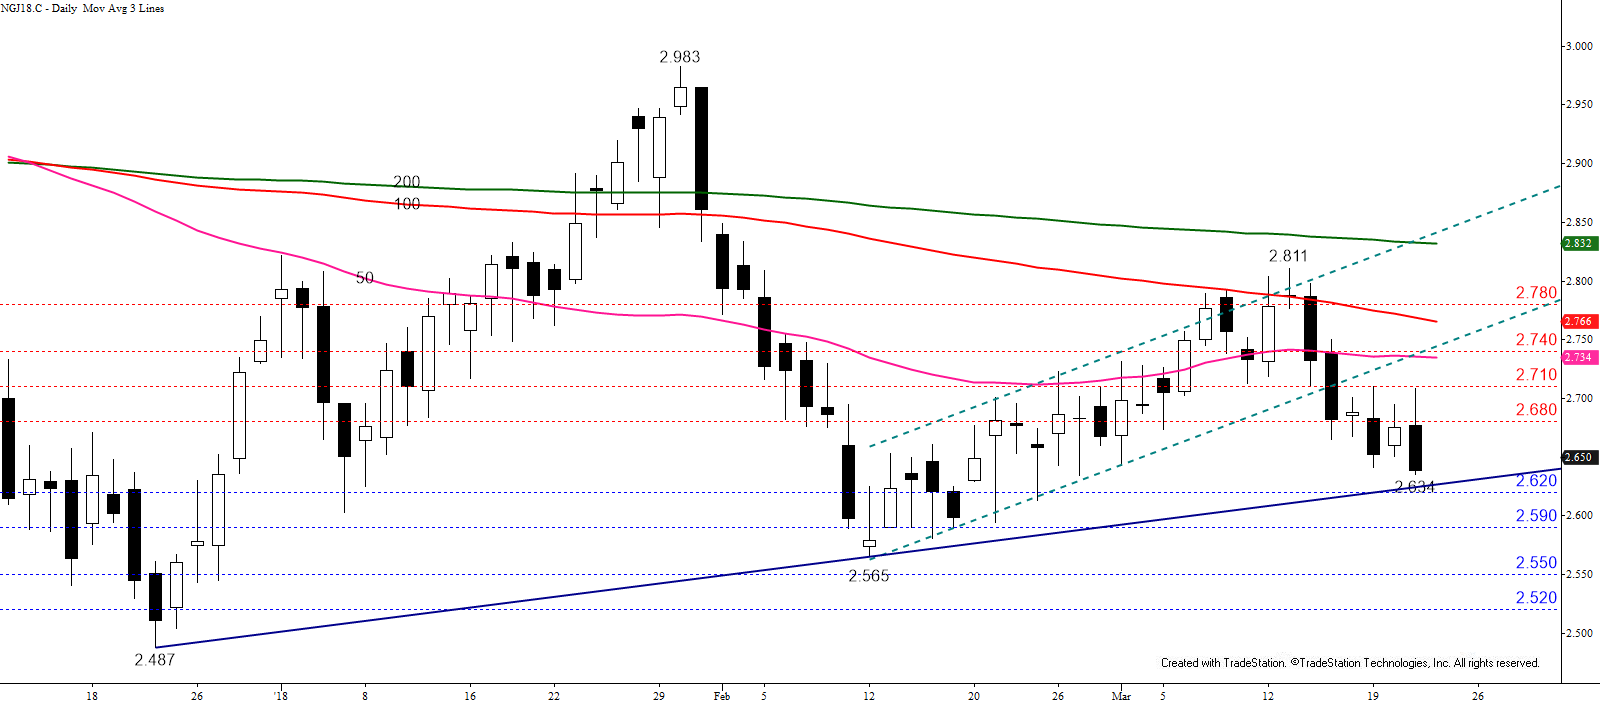
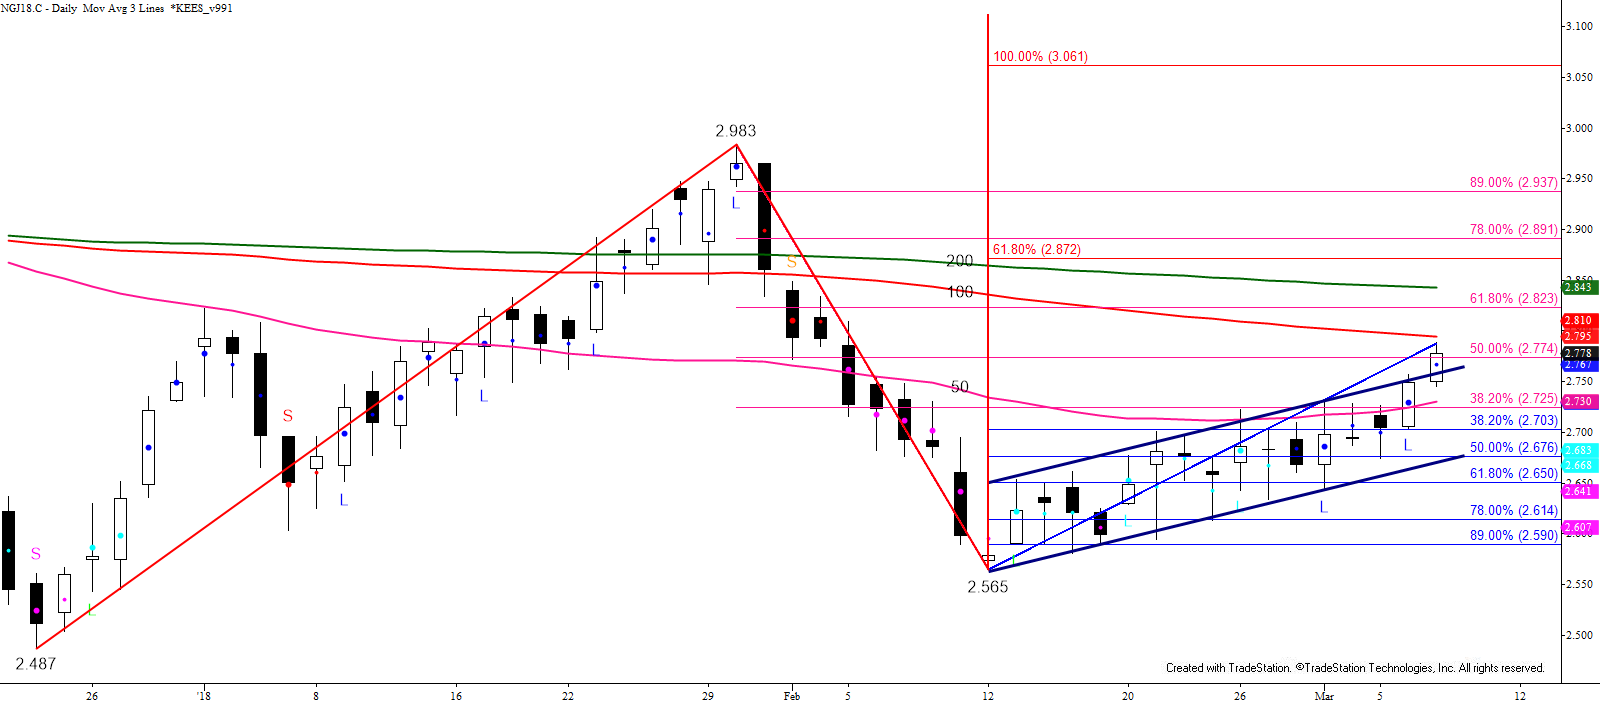
After holding support near $2.70 last week, June natural gas rallied and overcame the $2.844 swing high. This was somewhat positive, but the move stalled just below the more important $2.873 swing high. This swing defines the top of the trading range that has contained prices since mid-February. For now, odds still slightly favor a break higher out of the range, though the pullback from yesterday’s $2.864 swing high is poised to extend to at least $2.79 and possibly $2.76 first.
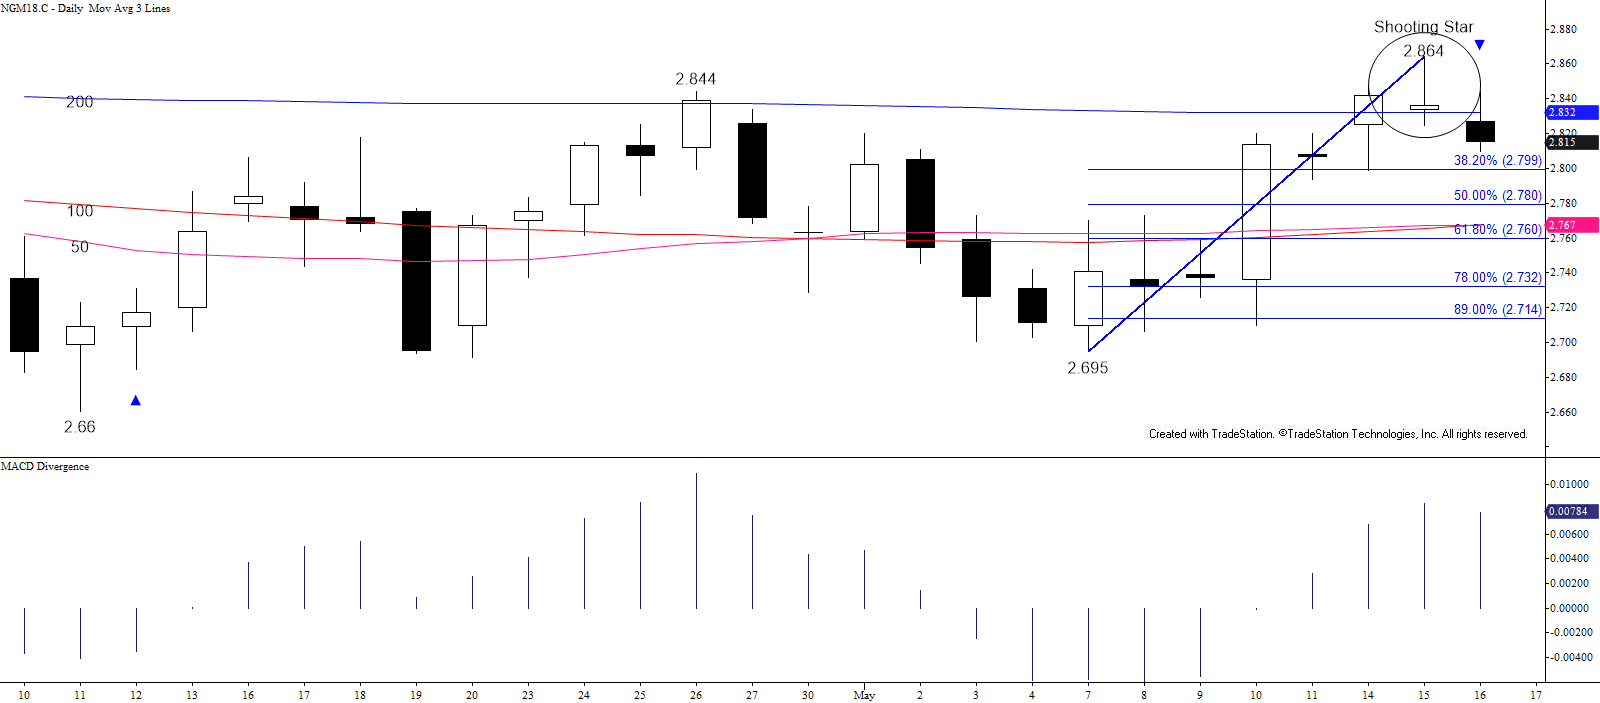
Support at $2.76 is most important for the near-term and could present a buying opportunity for those that missed last week’s move up or have locked in long profits over the past few days. Even so, a close below $2.76 would shift odds back in favor of $2.71. This is the lowest that the small wave down from $2.864 projects, so this level should hold unless there is a bearish surprise from external factors (i.e. a much larger than expected build tomorrow).
Should prices overcome the $2.873 swing high the market must still settle above a highly confluent objective at $2.90 to prove a break higher out of the range isn’t a false breakout. Therefore, $2.90 is key resistance, a close above which would open the way for $2.93, $2.96, and possibly higher.
This is a brief analysis for the next day or so. Our weekly Natural Gas Commentary and daily updates are much more detailed and thorough energy price forecasts that cover key natural gas futures contracts, calendar spreads, the UNG ETF, and several electricity contracts. If you are interested in learning more, please sign up for a complimentary four-week trial.