Gold Price Forecast – February 25, 2021

Gold Technical Analysis and Near-Term Outlook

Gold settled below crucial near-term support at $1780. This has positioned gold to challenge the $1759 swing low again. This is a bearish decision point for the long-term because $1759 is the smaller than (0.618) target of the primary wave down from $2107.6. Based on the more recent waves, the $1759 confluence point is lowered to $1756 +/- $4. This objective is expected to be challenged tomorrow. Closing below $1756 will substantially increase odds for a decline to the primary wave’s $1631 equal to (1.00) target in the coming weeks. For the near-term, a close below $1756 will clear the way for $1737, $1720, and $1695.

Gold - $10 Kase Bar Chart
Gold – $10 Kase Bar Chart

The $1756 target is the most confluent objective on the chart, so there is a modest chance that a double bottom could form around this area. There are no bullish patterns or signals that call for a double bottom to take shape, but this must be considered given the importance of the $1756 target.

With that said, should $1756 hold and gold rise above $1786 look for a test of key near-term resistance at $1799. This is currently the smaller than target of the wave up from $1759 and the 62 percent retracement of the decline from $1815.2. Closing above $1799 would call for a move toward $1820 again.

This is a brief analysis for the next day or so. Our weekly Metals Commentary and daily updates are much more detailed and thorough energy price forecasts that cover key COMEX precious metals futures contracts and LME Non-Ferrous (Base) metals, spot gold, the gold/silver ratio, and gold ETFs. If you are interested in learning more, please sign up for a complimentary four-week trial

Natural Gas Technical Analysis and Near-Term Outlook

Natural gas fell again today as expected and settled below the $2.80 target called for in Tuesday’s update and the 20-day moving average. The decline from $3.06 is now poised to test a crucial target at $2.76. This is the larger than (1.618) target of the primary wave down from $3.06 and is split between the 38 percent retracement of the rise from $2.308 and the 100-day moving average. This might prove to be stingy near-term support, especially in the case that tomorrow’s reported withdrawal is larger than expected. Nevertheless, the charts can only tell us what the market currently knows about itself. Based on this week’s decline, it looks as though the market is shaking off last week’s cold snap. Therefore, upon a close below $2.77 look for $2.69 and $2.60.

Natural Gas - Daily Chart
Natural Gas – Daily Chart

That said, caution is still warranted because a miss in either direction by consensus expectations for tomorrow’s storage report could quickly drive prices much higher or lower. At this point, there is probably more upside risk than downside too. Therefore, should natural gas overcome $2.89 look for a test of key near-term resistance at $2.96. Closing above this would reflect renewed bullish sentiment and warn that the move down might be complete. Closing above $3.03 would confirm this and clear the way for $3.08 and higher. Keep in mind that April’s primary wave up from the $2.07 contract low still favors an eventual rise to fulfill its $3.29 equal to (1.00) target, which is also the larger than target of the initial wave up from $2.308.

This is a brief analysis for the next day or so. Our weekly Natural Gas Commentary and daily updates are much more detailed and thorough energy price forecasts that cover key natural gas futures contracts, calendar spreads, the UNG ETF, and several electricity contracts. If you are interested in learning more, please sign up for a complimentary four-week trial.

WTI Crude Oil Technical Analysis and Short-Term Forecast

WTI crude oil initially rose as called for today but stalled just short of the crucial $63.2 objective. This is the larger than (1.618) target of the primary wave up from the April contract’s $28.15 low. There is little doubt that the outlook for WTI is bullish in the coming months, but the move up has been due for a significant test of support for a few weeks. The challenge has been that each time WTI has formed bearish patterns or signals the follow-through has been lackluster and WTI rises to new highs shortly thereafter.

WTI Crude Oil - $0.35 Kase Bar Chart
WTI Crude Oil – $0.35 Kase Bar Chart

Nevertheless, today’s pullback from $63.0 has set up a bearish high wave candlestick, momentum divergence, and a wave formation that calls for a test of $60.7 early tomorrow. Falling below this will clear the way for $59.8, which will take out Monday’s $60.3 midpoint and the 62 percent retracement of the rise from $58.6. Closing below $59.8 would then call for a test of Monday’s $58.9 midpoint and possibly $58.4. The $58.4 objective is the larger than (1.618) target of the wave down from $63.0 and the bearish threshold of the daily Kase Trend indicator. Settling below $58.4 would serve as a strong warning that a much more significant test of support is finally underway.

With that said, caution is warranted because the market is still absorbing information regarding the impact of last week’s cold snap throughout Texas and the Plains states. Should WTI overcome $62.1 before taking out $60.7 look for a test of $62.6, which then connects to key resistance at $63.2. Settling above $63.2 will reaffirm a bullish near-term outlook and open the way for $64.4 and likely $65.1 during the next few days.

This is a brief analysis for the next day or so. Our weekly Crude Oil Forecast and daily updates are much more detailed and thorough energy price forecasts that cover WTI, Brent, RBOB Gasoline, Diesel, and spreads. If you are interested in learning more, please sign up for a complimentary four-week trial.
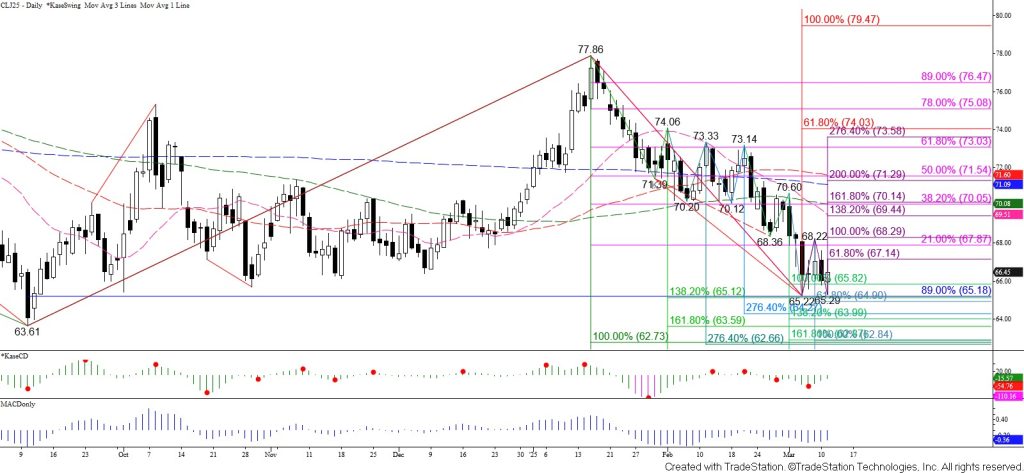
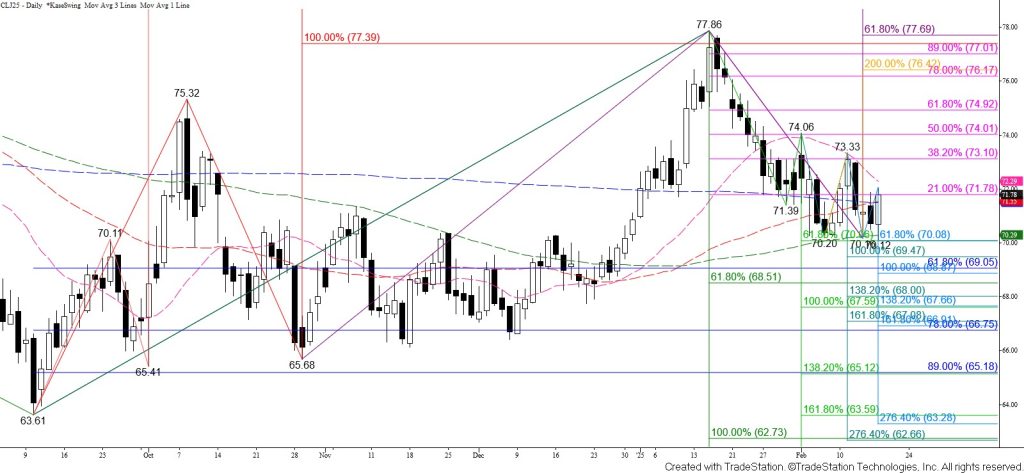
Gold Technical Analysis and Near-Term Outlook

Gold is still poised to challenge a major target and bearish decision point at $1759. This is a probable stalling point because it is the smaller than (0.618) target of the primary wave down from $2107.6 and the equal to (1.00) target of the more recent subwave down from $1878.9. However, a move up from $1759 will likely prove to be corrective of the decline. Closing below $1759 will clear the way for an eventual decline to the $1631 equal to (1.00) target of the primary wave down from $2107.6.

Gold - Daily Chart
Gold – Daily Chart

Today’s formation of an inverted hammer dampens near-term odds for a test of $1759 and warns that the move down might stall soon. Again, the most probable stalling point is $1759. Nevertheless, settling above $1791 will confirm the inverted hammer and call for a test of key near-term resistance at $1809. For now, this level is expected to hold, but closing above $1809 will call for a larger test of resistance and possibly a period of consolidation before the decline continues.

This is a brief analysis for the next day or so. Our weekly Metals Commentary and daily updates are much more detailed and thorough energy price forecasts that cover key COMEX precious metals futures contracts and LME Non-Ferrous (Base) metals, spot gold, the gold/silver ratio, and gold ETFs. If you are interested in learning more, please sign up for a complimentary four-week trial.

Natural Gas Technical Analysis and Near-Term Outlook

Natural gas rose as expected again today and has nearly fulfilled a crucial target and bullish decision point at $3.34. This is the larger than (1.618) target of the primary wave up from $2.268. It is also in line with the target of a rectangle pattern that prices broke higher out of yesterday. Normally, a pullback would be expected before overcoming the larger than target of such an important wave. However, external factors are quite extraordinary right now, so it would not be surprising to see prices overcome $3.34 during the next few days.

A sustained close above $3.34 will clear the way for $3.39, $3.45, and $3.55. However, it is important to note that given continue bullish sentiment from external factors (e.g., weather), there is potential for prices to rise to $3.99 and even $4.43. It is premature to call for such a move, but these are the XC (2.764) and trend terminus of the primary wave up from $2.268, respectively.

Natural Gas - $0.05 Kase Bar Chart
Natural Gas – $0.05 Kase Bar Chart

The daily RSI and Stochastic are overbought but can remain that way for an extended period during random events. Otherwise, there are no patterns or setups that call for the move up to stall other than the importance of resistance at $3.34. Even so, should natural gas take out $3.16 early tomorrow look for a test of key near-term support at $3.10. Settling below this would reflect a bearish shift in near-term sentiment and call for a test of $3.01 and possibly lower.

This is a brief analysis for the next day or so. Our weekly Natural Gas Commentary and daily updates are much more detailed and thorough energy price forecasts that cover key natural gas futures contracts, calendar spreads, the UNG ETF, and several electricity contracts. If you are interested in learning more, please sign up for a complimentary four-week trial.

WTI Crude Oil Technical Analysis and Short-Term Forecast

WTI crude oil rallied again today as called for in the weekly analysis and met the initial $60.8 target. A daily long-legged doji formed, but the pullback from $60.95 on the intra-day charts looks corrective. WTI is still due for a deeper test of support, but with diesel and gasoline prices looking strong again, WTI will be hard-pressed to fall. With these factors considered, near-term odds favor a continued rise and a close above $61.0 will call for a test of $61.9 and possibly $63.2 in the coming days. The $63.2 target is the next most probable stalling point because it is the larger than (1.618) target of the primary wave up from March’s $27.66 contract low.

Gold - $15 Kase Bar Chart
WTI Crude Oil – Daily Chart

That said, weekly and daily momentum oscillators remain overbought and the $61.0 objective is an important near-term threshold because it is the equal to (1.00) target of the primary subwave up from $35.0. Should $61.0 hold and prices fall, closing below $58.7 will complete today’s long-legged doji and closing below $57.9 will confirm the pattern. Such a move is doubtful during the next few days. Even so, this would be an early indication that a much more significant test of support is finally underway.

This is a brief analysis for the next day or so. Our weekly Crude Oil Forecast and daily updates are much more detailed and thorough energy price forecasts that cover WTI, Brent, RBOB Gasoline, Diesel, and spreads. If you are interested in learning more, please sign up for a complimentary four-week trial

Gold Technical Analysis and Near-Term Outlook

Gold is poised to decline. Today’s move down formed a bearish engulfing line and broke the neckline of an intra-day complex head and shoulders reversal pattern. Furthermore, the decline took out the $1826 equal to target of the wave down from $1856.6 and the 38 percent retracement of the rise from $1784.6. Gold is now positioned to fall to $1812. This is in line with the larger than (1.618) target of the wave down from $1856.6, the 62 percent retracement of the rise from $1784.6, and the complex head and shoulders’ target. Closing below $1812 might initially prove to be a challenge but will clear the way for the next major objectives at $1776 and $1759.

Gold - $5 Kase Bar Chart with Head and Shoulders Reversal Pattern
Gold – $5 Kase Bar Chart with Head and Shoulders Reversal Pattern

Nevertheless, the move down might still prove to be corrective. This has become doubtful given the combination of bearish technical factors today. However, a close above $1843 will call for the $1848.6 swing high to be overcome. This would invalidate the complex head and shoulders and call for a test of key near-term resistance at $1861. Settling above $1861 would shift near-term odds in favor of challenging $1877, which is now split between the 100- and 200-day moving averages. This level is the last level of resistance before a $1901 bullish decision point.

This is a brief analysis for the next day or so. Our weekly Metals Commentary and daily updates are much more detailed and thorough energy price forecasts that cover key COMEX precious metals futures contracts and LME Non-Ferrous (Base) metals, spot gold, the gold/silver ratio, and gold ETFs. If you are interested in learning more, please sign up for a complimentary four-week trial.

Natural Gas Technical Analysis and Near-Term Outlook

Natural gas briefly fell below $2.77 support before rallying above the 62 percent retracement of the decline from $3.057. The move up is poised to challenge the crucial $2.99 objective again early tomorrow. Based on today’s rise, odds favor a move above $2.99 and a test of $3.06. Settling above $3.06 will clear the way for $3.13 and likely $3.20 in the coming days.

There is little technical evidence that suggests the move up will stall again at $2.99. Even so, this has been a resilient threshold. Should $2.99 hold and prices begin to pullback again look for support at $2.89 and $2.83. Falling below $2.83 would imply that a head and shoulders pattern has formed. It is doubtful that this pattern will take shape, but such a move would reflect a bearish shift in external factors (e.g., weather) and sentiment. Closing below $2.78, the smaller than (0.618) target of the newly formed wave down from $3.057, would call for the $2.73 neckline of the head and shoulders to be broken and for prices to fall toward $2.65 and likely lower.

Natural Gas - $0.05 Kase Bar Chart
Natural Gas – $0.05 Kase Bar Chart

This is a brief analysis for the next day or so. Our weekly Natural Gas Commentary and daily updates are much more detailed and thorough energy price forecasts that cover key natural gas futures contracts, calendar spreads, the UNG ETF, and several electricity contracts. If you are interested in learning more, please sign up for a complimentary four-week trial.

WTI Crude Oil Technical Analysis and Short-Term Forecast

WTI crude oil rose as expected today and challenged the $58.5 target discussed in Monday’s analysis. The move up is now poised to reach a crucial bullish decision point at $59.1. This is the intermediate (1.382) target of the March contract’s primary wave up from $27.66 and the equal to (1.00) target of the largest subwave up from $46.3. Overbought weekly and daily momentum oscillators, bearish divergence setups, and today’s hanging man all warn that the move up is nearing exhaustion. Therefore, $59.1 is a probable stalling point. However, settling above $59.1 for a few days will clear the way for a test of $60.0 and eventually a push toward the uptrend’s next major objective at $63.2. The $63.2 objective is the larger than (1.618) target of the wave up from $27.66.

WTI Crude Oil - Daily Chart
WTI Crude Oil – Daily Chart

As mentioned, today’s hanging man and the weekly and daily momentum oscillators warn that the move up will probably stall soon. The most probable stalling point is $59.1. However, as of this afternoon, there are no confirmed bearish patterns or signals that call for a significant test of support before reaching $59.1. Initial support at $57.7 is expected to hold tomorrow and $57.1 is key. Settling below $57.1 will confirm today’s hanging man and clear the way for a test of $56.0 and possibly lower before the uptrend fulfills the $59.1 objective.

This is a brief analysis for the next day or so. Our weekly Crude Oil Forecast and daily updates are much more detailed and thorough energy price forecasts that cover WTI, Brent, RBOB Gasoline, Diesel, and spreads. If you are interested in learning more, please sign up for a complimentary four-week trial

Gold Technical Analysis and Near-Term Outlook

Gold fell as called for after breaking lower out of a flat ascending triangle and took out the $1804.7 swing low. This invalidated the waves up from $1804.7 and has cleared the way for a test of $1779 tomorrow. This is the smaller than (0.618) target of the primary wave down from $1966.8. Therefore, once $1779 is met odds for an eventual decline to this wave’s $1717 equal to (1.00) target will increase to better than even in the coming weeks.

Furthermore, taking out $1779 will call for a move to challenge $1759. This is structurally the most important objective on the chart because it is the smaller than target of the primary wave down from $2107.6. Settling below this will call for a much firmer bearish outlook in the coming weeks and perhaps longer because the equal to target for this wave is $1631.

Gold - $15 Kase Bar Chart
Gold – $15 Kase Bar Chart

With that said, $1779 is currently the most confluent target on the chart. Therefore, from a near-term perspective, once $1779 is met a test of resistance is anticipated. Nevertheless, any move up from $1779 will most likely prove to be corrective of a larger decline and should hold $1817. Key near-term resistance is $1834, a close above which would call for $1856 and possibly higher.

This is a brief analysis for the next day or so. Our weekly Metals Commentary and daily updates are much more detailed and thorough energy price forecasts that cover key COMEX precious metals futures contracts and LME Non-Ferrous (Base) metals, spot gold, the gold/silver ratio, and gold ETFs. If you are interested in learning more, please sign up for a complimentary four-week trial