Gold Price Forecast – February 11, 2021

Gold Technical Analysis and Near-Term Outlook

Gold is poised to decline. Today’s move down formed a bearish engulfing line and broke the neckline of an intra-day complex head and shoulders reversal pattern. Furthermore, the decline took out the $1826 equal to target of the wave down from $1856.6 and the 38 percent retracement of the rise from $1784.6. Gold is now positioned to fall to $1812. This is in line with the larger than (1.618) target of the wave down from $1856.6, the 62 percent retracement of the rise from $1784.6, and the complex head and shoulders’ target. Closing below $1812 might initially prove to be a challenge but will clear the way for the next major objectives at $1776 and $1759.

Gold - $5 Kase Bar Chart with Head and Shoulders Reversal Pattern
Gold – $5 Kase Bar Chart with Head and Shoulders Reversal Pattern

Nevertheless, the move down might still prove to be corrective. This has become doubtful given the combination of bearish technical factors today. However, a close above $1843 will call for the $1848.6 swing high to be overcome. This would invalidate the complex head and shoulders and call for a test of key near-term resistance at $1861. Settling above $1861 would shift near-term odds in favor of challenging $1877, which is now split between the 100- and 200-day moving averages. This level is the last level of resistance before a $1901 bullish decision point.

This is a brief analysis for the next day or so. Our weekly Metals Commentary and daily updates are much more detailed and thorough energy price forecasts that cover key COMEX precious metals futures contracts and LME Non-Ferrous (Base) metals, spot gold, the gold/silver ratio, and gold ETFs. If you are interested in learning more, please sign up for a complimentary four-week trial.

Natural Gas Technical Analysis and Near-Term Outlook

Natural gas briefly fell below $2.77 support before rallying above the 62 percent retracement of the decline from $3.057. The move up is poised to challenge the crucial $2.99 objective again early tomorrow. Based on today’s rise, odds favor a move above $2.99 and a test of $3.06. Settling above $3.06 will clear the way for $3.13 and likely $3.20 in the coming days.

There is little technical evidence that suggests the move up will stall again at $2.99. Even so, this has been a resilient threshold. Should $2.99 hold and prices begin to pullback again look for support at $2.89 and $2.83. Falling below $2.83 would imply that a head and shoulders pattern has formed. It is doubtful that this pattern will take shape, but such a move would reflect a bearish shift in external factors (e.g., weather) and sentiment. Closing below $2.78, the smaller than (0.618) target of the newly formed wave down from $3.057, would call for the $2.73 neckline of the head and shoulders to be broken and for prices to fall toward $2.65 and likely lower.

Natural Gas - $0.05 Kase Bar Chart
Natural Gas – $0.05 Kase Bar Chart

This is a brief analysis for the next day or so. Our weekly Natural Gas Commentary and daily updates are much more detailed and thorough energy price forecasts that cover key natural gas futures contracts, calendar spreads, the UNG ETF, and several electricity contracts. If you are interested in learning more, please sign up for a complimentary four-week trial.

WTI Crude Oil Technical Analysis and Short-Term Forecast

WTI crude oil rose as expected today and challenged the $58.5 target discussed in Monday’s analysis. The move up is now poised to reach a crucial bullish decision point at $59.1. This is the intermediate (1.382) target of the March contract’s primary wave up from $27.66 and the equal to (1.00) target of the largest subwave up from $46.3. Overbought weekly and daily momentum oscillators, bearish divergence setups, and today’s hanging man all warn that the move up is nearing exhaustion. Therefore, $59.1 is a probable stalling point. However, settling above $59.1 for a few days will clear the way for a test of $60.0 and eventually a push toward the uptrend’s next major objective at $63.2. The $63.2 objective is the larger than (1.618) target of the wave up from $27.66.

WTI Crude Oil - Daily Chart
WTI Crude Oil – Daily Chart

As mentioned, today’s hanging man and the weekly and daily momentum oscillators warn that the move up will probably stall soon. The most probable stalling point is $59.1. However, as of this afternoon, there are no confirmed bearish patterns or signals that call for a significant test of support before reaching $59.1. Initial support at $57.7 is expected to hold tomorrow and $57.1 is key. Settling below $57.1 will confirm today’s hanging man and clear the way for a test of $56.0 and possibly lower before the uptrend fulfills the $59.1 objective.

This is a brief analysis for the next day or so. Our weekly Crude Oil Forecast and daily updates are much more detailed and thorough energy price forecasts that cover WTI, Brent, RBOB Gasoline, Diesel, and spreads. If you are interested in learning more, please sign up for a complimentary four-week trial

Gold Technical Analysis and Near-Term Outlook

Gold fell as called for after breaking lower out of a flat ascending triangle and took out the $1804.7 swing low. This invalidated the waves up from $1804.7 and has cleared the way for a test of $1779 tomorrow. This is the smaller than (0.618) target of the primary wave down from $1966.8. Therefore, once $1779 is met odds for an eventual decline to this wave’s $1717 equal to (1.00) target will increase to better than even in the coming weeks.

Furthermore, taking out $1779 will call for a move to challenge $1759. This is structurally the most important objective on the chart because it is the smaller than target of the primary wave down from $2107.6. Settling below this will call for a much firmer bearish outlook in the coming weeks and perhaps longer because the equal to target for this wave is $1631.

Gold - $15 Kase Bar Chart
Gold – $15 Kase Bar Chart

With that said, $1779 is currently the most confluent target on the chart. Therefore, from a near-term perspective, once $1779 is met a test of resistance is anticipated. Nevertheless, any move up from $1779 will most likely prove to be corrective of a larger decline and should hold $1817. Key near-term resistance is $1834, a close above which would call for $1856 and possibly higher.

This is a brief analysis for the next day or so. Our weekly Metals Commentary and daily updates are much more detailed and thorough energy price forecasts that cover key COMEX precious metals futures contracts and LME Non-Ferrous (Base) metals, spot gold, the gold/silver ratio, and gold ETFs. If you are interested in learning more, please sign up for a complimentary four-week trial

Natural Gas Technical Analysis and Near-Term Outlook

Natural gas fell as called for and settled just below Monday’s $2.79 midpoint. This completed yesterday’s shooting star and calls for a deeper test of support. Tomorrow, look for the evening star’s $2.73 confirmation point to be challenged. Additionally, the waves and subwaves down from $3.005 favor a decline to $2.69. For the move up to retain a reasonable chance of extending again during the next few days, $2.69 must hold. Closing below this will call for $2.63 and possibly $2.56, the lower of which is an area where Monday’s gap up would be filled.

Natural Gas - $0.03 Kase Bar Chart
Natural Gas – $0.03 Kase Bar Chart

That said, the late move down from $2.839 held the $2.748 swing low and formed a small up wave. Should natural gas overcome $2.82 in early trading tomorrow look for a test of this wave’s $2.85 equal to (1.00) target. This is also the 38 percent retracement of the decline from $3.005. Rising above $2.85 will call for $2.91, the larger than (1.618) target and 62 percent retracement. Settling above $2.91 would dampen odds for a deeper test of support and call for $2.99, the barrier to a renewed bullish near-term outlook.

This is a brief analysis for the next day or so. Our weekly Natural Gas Commentary and daily updates are much more detailed and thorough energy price forecasts that cover key natural gas futures contracts, calendar spreads, the UNG ETF, and several electricity contracts. If you are interested in learning more, please sign up for a complimentary four-week trial.

WTI Crude Oil Technical Analysis and Short-Term Forecast

WTI crude oil rose as called for in Monday’s daily update and stalled just below the $55.4 target. The move up is still poised to extend and it now looks as though the rise from $51.64 is forming a small five-wave pattern that targets $56.5. This is the XC (2.764) target of Wave 1 and the smaller than (0.618) target of Wave 3. The $56.5 target is a potential stalling point, but any pullback from that level will likely prove to be a three-wave correction. This is because the larger wave structures favor $57.6 and higher upon a sustained close above $55.5.

WTI Crude Oil - $0.35 Kase Bar Chart
WTI Crude Oil – $0.35 Kase Bar Chart

There are no bearish patterns or signals that call for a reversal. Even so, the daily RSI is overbought again and the KasePO, RSI, and Stochastic are setup for bearish divergence signals. To confirm these signals WTI will have to form both price and momentum peaks during the next few days, which is currently doubtful.

Nonetheless, should WTI take out $54.0 before rising much higher look for a test of key near-term support at $53.0. This is the 62 percent retracement of the rise from $51.64. Settling below $53.0 would reflect a bearish shift in the external factors that have driven WTI higher during the last few days and call for a deeper test of support with thresholds at $52.2 and $51.3.

This is a brief analysis for the next day or so. Our weekly Crude Oil Forecast and daily updates are much more detailed and thorough energy price forecasts that cover WTI, Brent, RBOB Gasoline, Diesel, and spreads. If you are interested in learning more, please sign up for a complimentary four-week trial.
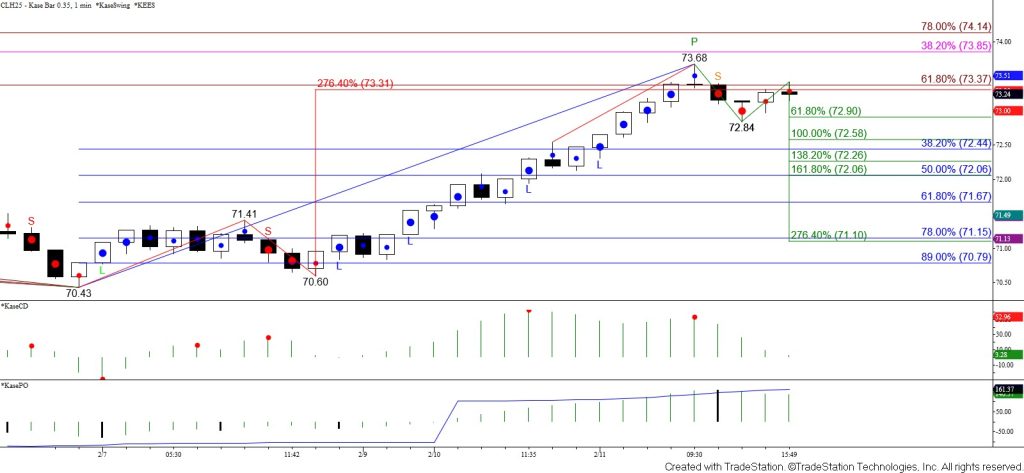
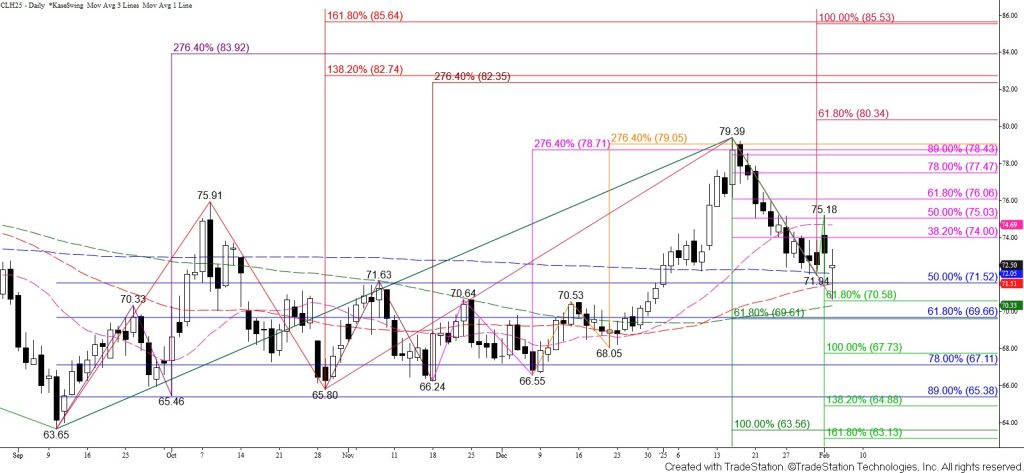
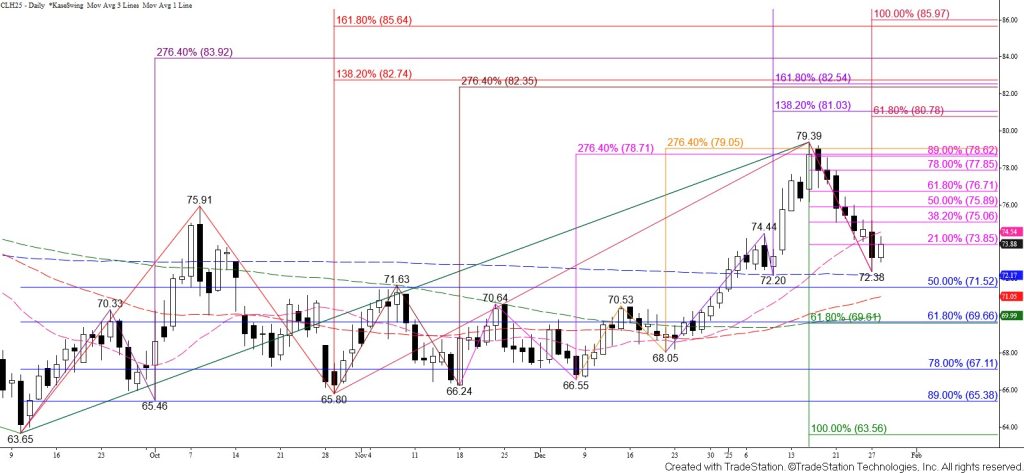
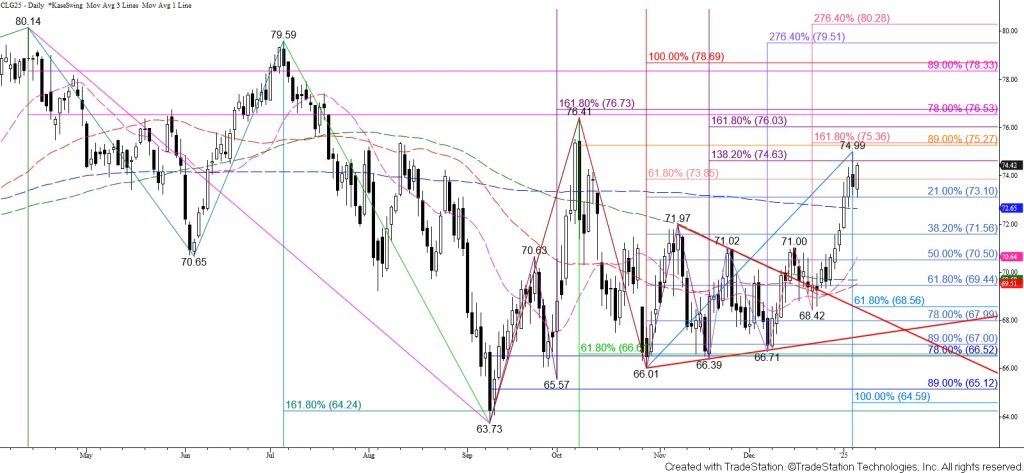
Gold Technical Analysis and Near-Term Outlook

Gold retains a bearish near-term outlook after falling to the $1834 smaller than (0.618) target of the newly formed primary wave down from $1874.6. There is immediate support at $1829 still. However, barring any random influence from external factors, this wave down from $1874.6 is now poised to reach its $1817 equal to (1.00) target. Closing below $1817 will clear the way for $1802 and lower.

Gold - $15 Kase Bar Chart
Gold – $15 Kase Bar Chart

Nevertheless, the decline from $1874.6 has been quite choppy and might still prove to be corrective of a larger move up from $1800.8. Should gold overcome $1855 look for a test of $1874. This is the smaller than target of the wave up from $1800.8 and the barrier to a more significant test of resistance. Settling above $1874 would clear the way for $1902 and possibly $1926, the higher of which is the gateway to a bullish outlook.

This is a brief analysis for the next day or so. Our weekly Metals Commentary and daily updates are much more detailed and thorough energy price forecasts that cover key COMEX precious metals futures contracts and LME Non-Ferrous (Base) metals, spot gold, the gold/silver ratio, and gold ETFs. If you are interested in learning more, please sign up for a complimentary four-week trial

Natural Gas Technical Analysis and Near-Term Outlook

The near-term outlook for natural gas is bullish after meeting the smaller than (0.618) target of the primary wave up from $2.425 and settling above the 62 percent retracement of the decline from $2.835 and the 50-day moving average. Closing above $2.74 will call for a test of $2.78, the smaller than (0.618) target of the primary wave up from $2.268. This is also the barrier to a more bullish outlook during the next few weeks.

Natural Gas - $0.025 Kase Bar Chart
Natural Gas – $0.025 Kase Bar Chart

With that said, overcoming $2.78 will require another significant boost from bullish external factors (e.g., cold weather). Without such a spark there is still a reasonable chance that natural gas prices are settling into a trading range between nominally $2.78 and $2.49.

To that end, this afternoon’s pullback from today’s $2.74 high has already retraced 21 percent of the rise from $2.425. This pullback suggests that there is a reasonable chance for a deeper test of support before rising to challenge $2.74 again. For the move up to overcome $2.74 and make the push to $2.78 during the next few days, $2.62 must hold. Closing below this would signal that a trading range is forming and call for $2.55 and possibly $2.49. The $2.49 level is the gateway for a bearish outlook because this is the smaller than target of the newly formed primary wave down from $2.835.

This is a brief analysis for the next day or so. Our weekly Natural Gas Commentary and daily updates are much more detailed and thorough energy price forecasts that cover key natural gas futures contracts, calendar spreads, the UNG ETF, and several electricity contracts. If you are interested in learning more, please sign up for a complimentary four-week trial.

WTI Crude Oil Technical Analysis and Short-Term Forecast

WTI crude oil rose to challenge $53.3 as called for in yesterday’s update. The move up stalled near this threshold and began to pull back again. So far, the move down from $53.25 has retraced just over 38 percent of the move up from $51.44. This is still not a clear call higher or lower, but based on today’s price action, odds lean in favor of testing $51.8 tomorrow. Closing below this will clear the way for $50.6, a confluent wave projection, retracement, and the target for the intra-day triple top that formed around $53.9.

WTI Crude Oil - $0.35 Kase Bar Chart
WTI Crude Oil – $0.35 Kase Bar Chart

Nevertheless, there is little doubt that the move down from $53.94 will prove to be corrective of the larger scale uptrend. Furthermore, because $52.56, the 38 percent retracement if the rise from $51.44, held on a closing basis there is still a good chance that the pullback from $52.35 is a simple correction of the wave formation up from $51.44. Should WTI overcome $53.3 look for a test of the $53.94 swing high. Settling above this will clear the way for $54.8 and higher.

This is a brief analysis for the next day or so. Our weekly Crude Oil Forecast and daily updates are much more detailed and thorough energy price forecasts that cover WTI, Brent, RBOB Gasoline, Diesel, and spreads. If you are interested in learning more, please sign up for a complimentary four-week trial

Gold Technical Analysis and Near-Term Outlook

Gold gained a bit of bullish momentum for the near-term after rising above the $1864 swing high and settling back above the 200-day moving average yesterday. Furthermore, the wave up from $1800.8 fulfilled its $1866 smaller than (0.618) target. This is important because waves that meet the smaller than target generally fulfill their equal to (1.00) target, in this case, $1885. Settling above $1885 will call for a test of the $1905 intermediate (1.382) target, which is also in line with the 62 percent retracement of the decline from $1962.5.

Gold - $15 Kase Bar Chart
Gold – $15 Kase Bar Chart

As stated in yesterday’s analysis, for the larger scale move down to retain a reasonable chance at extending $1905 must hold. Closing above $1905 would imply that gold is adopting a firmer bullish outlook and call for a test of $1922. This is the larger than (1.618) target of the wave up from $1800.8 and the smaller than target of the more important wave up from $1767.2.

Nevertheless, today’s lackluster follow-through after yesterday’s rally formed a daily hanging man. Normally, this type of pattern is most effective at predicting a reversal at the top of a long-term uptrend. Even so, today’s trading suggests the move up might still prove to be a short-lived correction. Falling below $1846 will call for key support at $1829. Closing below $1829 will confirm the hanging man and invalidate the wave up from $1800.8 that makes the connection to $1885 and higher.

This is a brief analysis for the next day or so. Our weekly Metals Commentary and daily updates are much more detailed and thorough energy price forecasts that cover key COMEX precious metals futures contracts and LME Non-Ferrous (Base) metals, spot gold, the gold/silver ratio, and gold ETFs. If you are interested in learning more, please sign up for a complimentary four-week trial.