Natural Gas Technical Analysis and Near-Term Outlook
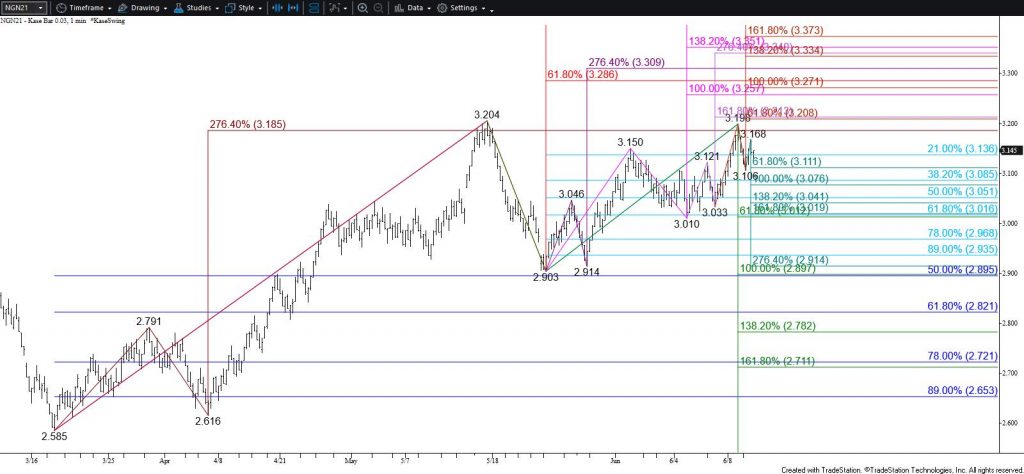
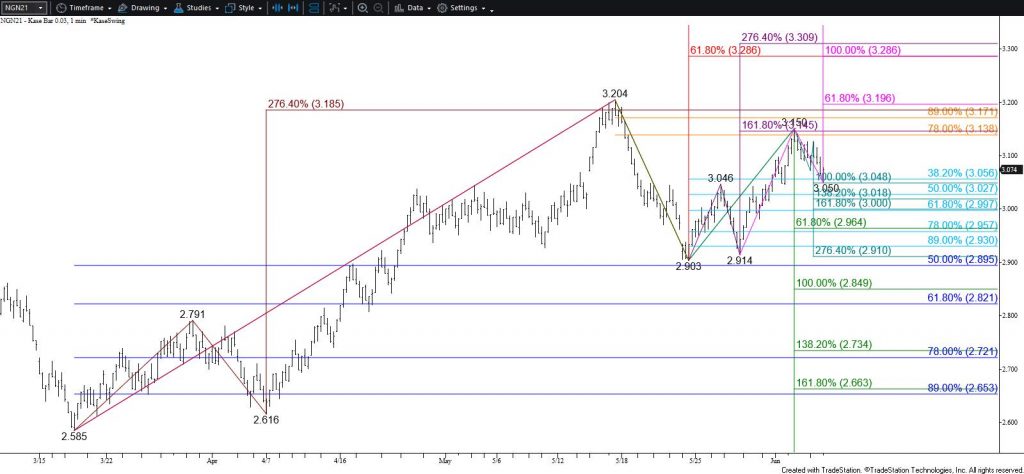
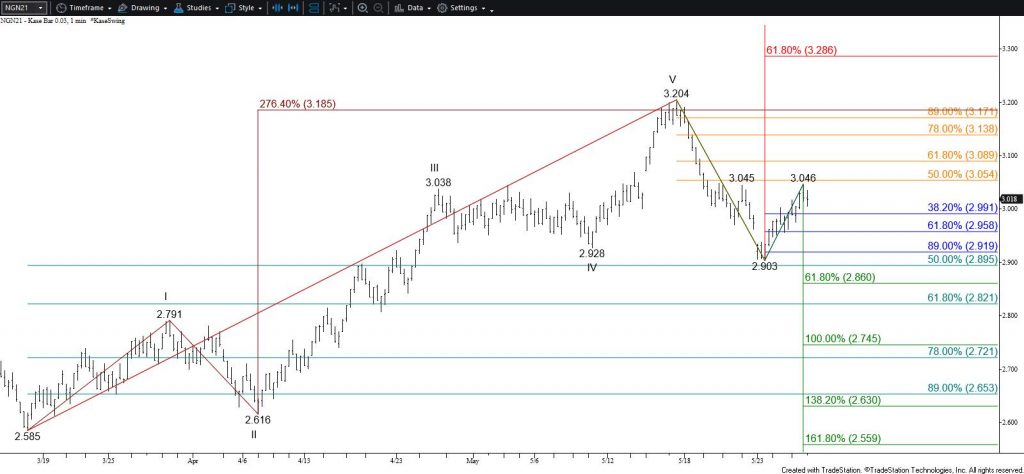
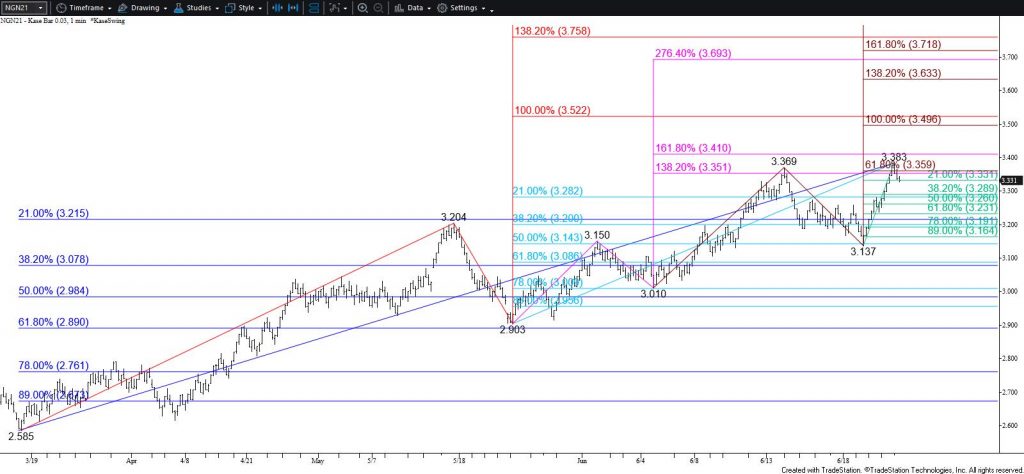
July natural gas rose to a new high of $3.383 but stalled short of reaching the next major objective at $3.40. Additionally, resistance around $3.35 held on a closing basis. Near-term odds still favor a test of $3.40, and a move back above $3.35 early tomorrow will increase those odds. The $3.40 target is highly confluent and a structurally important projection for the waves up from $2.165 and $2.585. This is a potential stalling point, although an eventual close above $3.40 will call for a push toward another major objective at $3.52.
With that said, one could argue that the pullback from $3.383 suggests a double top with the prior $3.369 double top is forming. The confirmation point for this potential pattern is $3.137, a level that will not likely be met during the next few days. However, based on the pullback there is a good chance for a test of $3.29 and possibly $3.36 first. Key support and the barrier for a near-term bearish outlook is $3.23. Settling below this would shift odds in favor of a deeper test of support before the move up continues to $3.40 and higher.
This is a brief analysis for the next day or so. Our weekly Natural Gas Commentary and daily updates are much more detailed and thorough energy price forecasts that cover key natural gas futures contracts, calendar spreads, the UNG ETF, and several electricity contracts. If you are interested in learning more, please sign up for a complimentary four-week trial.