 By Cynthia Kase
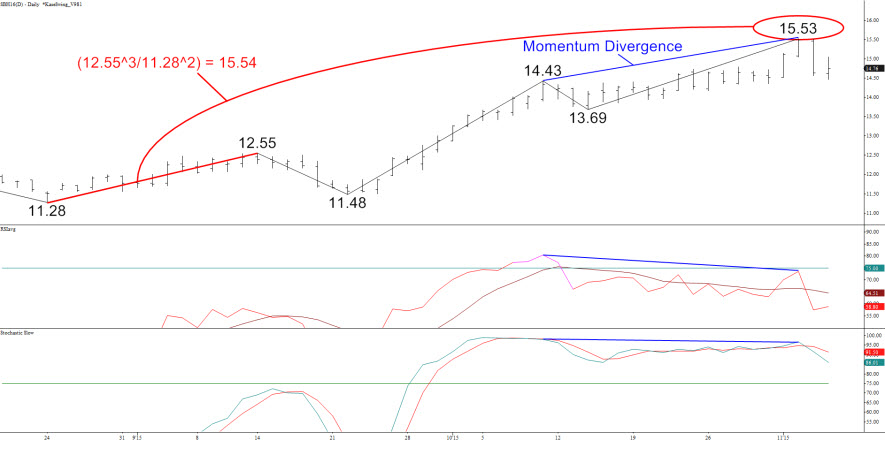
The market’s been watching the impact of El Niño since June. Then the National Oceanic and Atmospheric Administration said there was a 90 percent chance the baby would stick around all summer, and maybe even into 2016. Sugar has been rising since mid-August, as El Niño persisted, but turned choppy in October only to break to 15.53¢ as of the 3rd.
Apparently Niño’s wet weather is delaying the sugar harvest and fears have grown about undersupply. The technicals have been positive but slammed up against resistance at 15.53¢. So while it’s too soon to say if 15.53¢ is “it”, there is likely more downside.
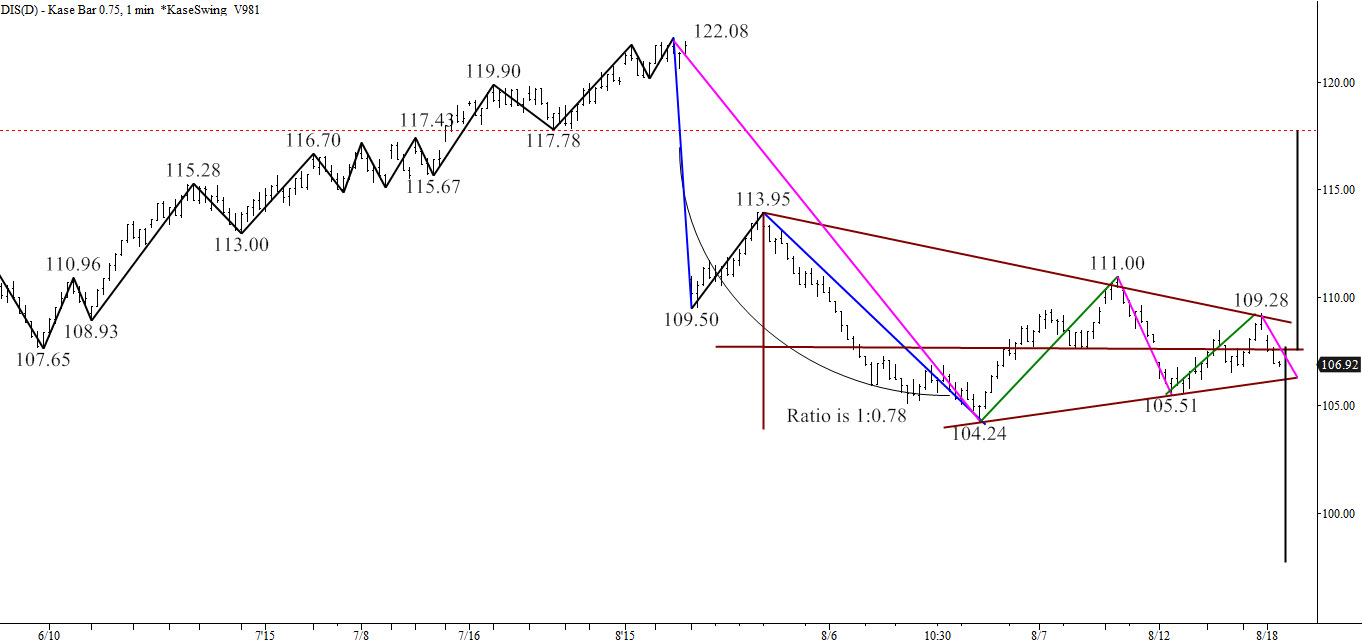
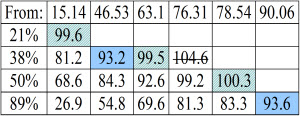
15.53¢ is important for a few reasons. It failed by 5 points to reach the 21 percent retracement of the entire move down from 36.08¢ to 10.13¢ on the continuation chart. Second, the Stochastic and RSI momentum indicators were set up for bearish divergences at that price. Most important, 15.53¢ was a confluent target, as shown in the chart. That price is just 0.01 points shy of March’s “trend terminus” target (12.55^3/11.28^2) for the first wave up from 11.28¢.
 Charts created using TradeStation. ©TradeStation Technologies, Inc. 2001-2015. All rights reserved. No investment or trading advice, recommendation or opinions are being given or intended.
First support was met on Wednesday at 14.64¢. Next is 14.40¢, just 7 points below Thursday’s low. This is the 21 percent retracement for continuation’s entire move up, and a confluent retracement for the intermediate swings on both charts. It is also the 0.62 projection for the wave 15.53 – 14.47 – 15.05.
The key question is whether the decline, which only reached 15.47¢ versus 15.40¢ support, is over. The fact that the bounce up from 15.47¢ formed an ABC pattern where C is the 1.62 extension of A, exactly, and that prices then declined to 14.59¢, that is, below the prior 14.64¢ swing, means probably not.
14.40¢ remains to be broken, so a continued decline is not a sure thing, but 14¢, the major threshold, is likely.
The open and midpoints of candlesticks constitute support and resistance. Last week’s midpoint was 14.37¢ and the open for the week ending October 9, the last large up week prior, was 13.92¢. There’s also an important swing at 13.94¢. So as long as this holds (the lower end of a 14¢ +/- 0.1¢ range), odds are open for the bull market to resume.
Initial resistance is 15.40¢. The decline isn’t dead unless this is overcome. Above this, a highly confluent 15.95¢, the last remaining target (the Phi^3 corrective projection) for the first wave up, and occurs as a target 10 times for the 10 waves up from mid-October’s 13.69¢ swing low. The highest price to which the March chart projects which has a moderate probability is 18¢, the 0.62 projection of the entire move up.
Send questions to askkase@kaseco.com, and click the link learn more about Cynthia Kase’s latest video series, Kase on Technical Analysis.
 by
by 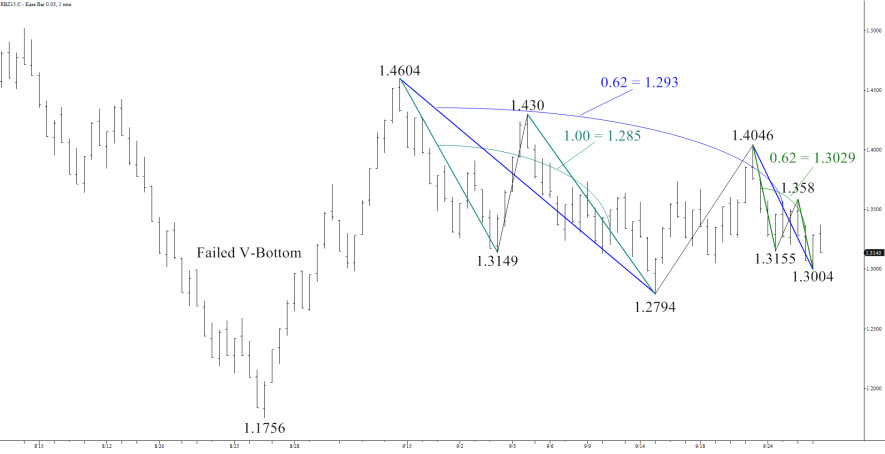
 By
By  Charts created using TradeStation. ©TradeStation Technologies, Inc. 2001-2015. All rights reserved. No investment or trading advice, recommendation or opinions are being given or intended.
 Read on