WTI Crude Oil Technical Analysis and Short-Term Forecast
This is a brief analysis for the next day or so. Our weekly Crude Oil Forecast is a much more detailed and thorough energy price forecasts that cover WTI, Brent, RBOB Gasoline, Diesel, and spreads. Daily updates are included. If you are interested in learning more, please sign up for a complimentary four-week trial.
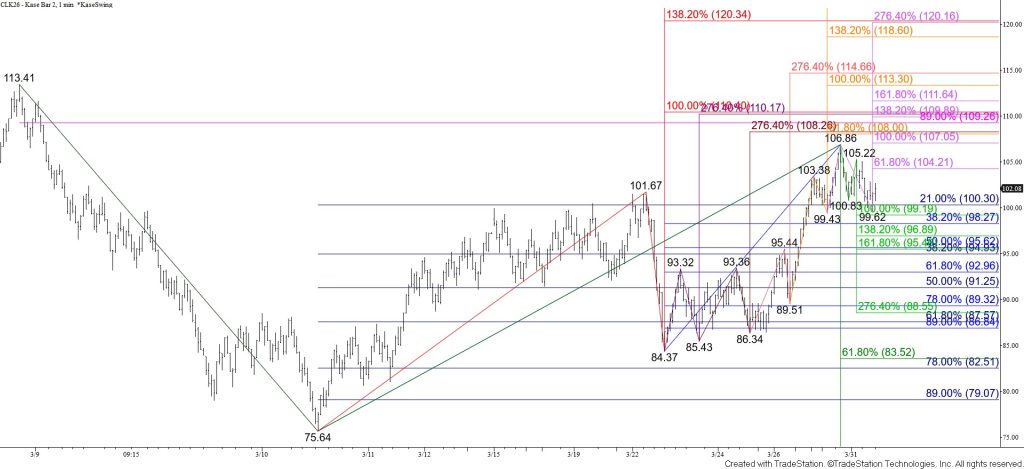
May WTI crude oil’s wave up from $75.64 favors an eventual test of its $110.2 equal to (1.00) target. However, today’s pullback from $106.86 engulfed Monday’s long-legged doji. An intraday head and shoulders pattern with a complex right shoulder also formed, and the wave down from $106.86 favors a test of $98.8. This will break the neckline of the head and shoulders pattern around $99.5. Closing below $98.8 will also open the way for a test of $95.2 and possibly the head and shoulders’ target at $92.5, which is in line with the 62 percent retracement of the rise from $84.37. Therefore, the outlook for the next day or so leans in favor of a deeper test of support due to today’s bearish engulfing line and the intraday head and shoulders pattern.
Nevertheless, even in the case that the pullback from $106.86 extends, the move down is likely a correction of the broader uptrend. There is a modest chance for a test of the $104.2 smaller than (0.618) target of the wave up from $99.43 early Wednesday. This is also in line with the 62 percent retracement from $106.86. Overcoming $104.2 will imply that the corrective pullback is complete. In this case, look for a test of $107.5, a close above which will put the near-term odds back in favor of May WTI rising to challenge the highly confluent $110.2 threshold.