Crude Oil Short-Term Forecast – May 1, 2018

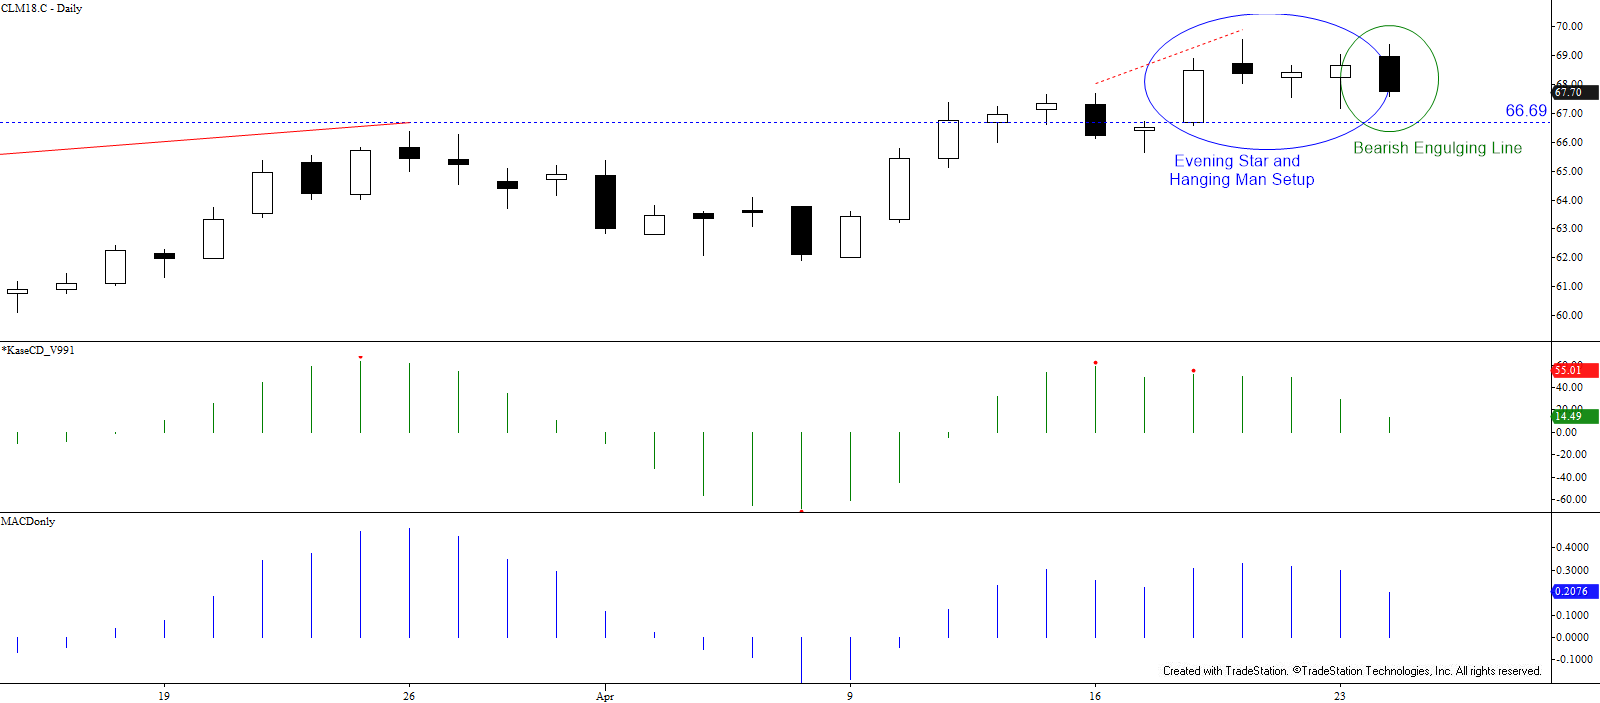
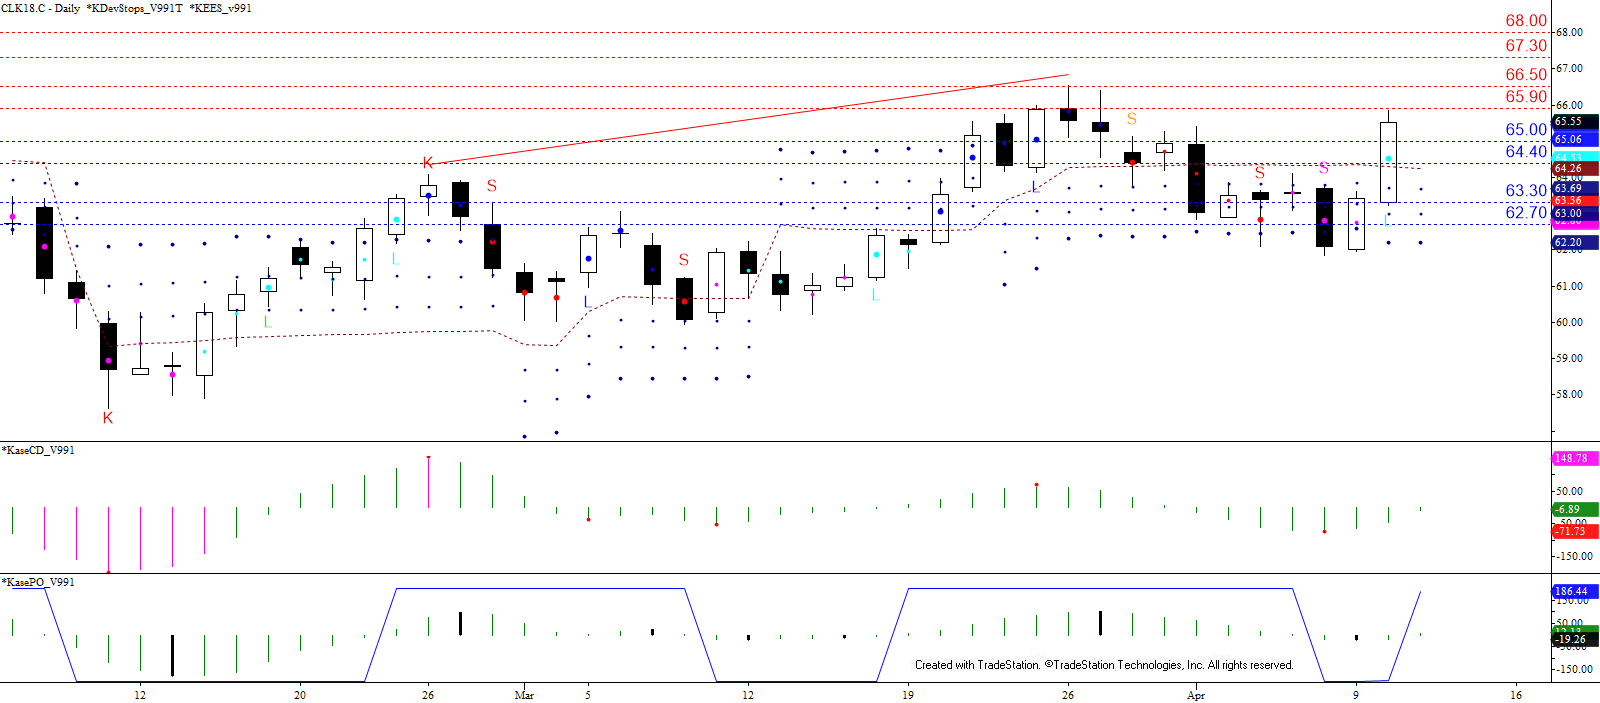
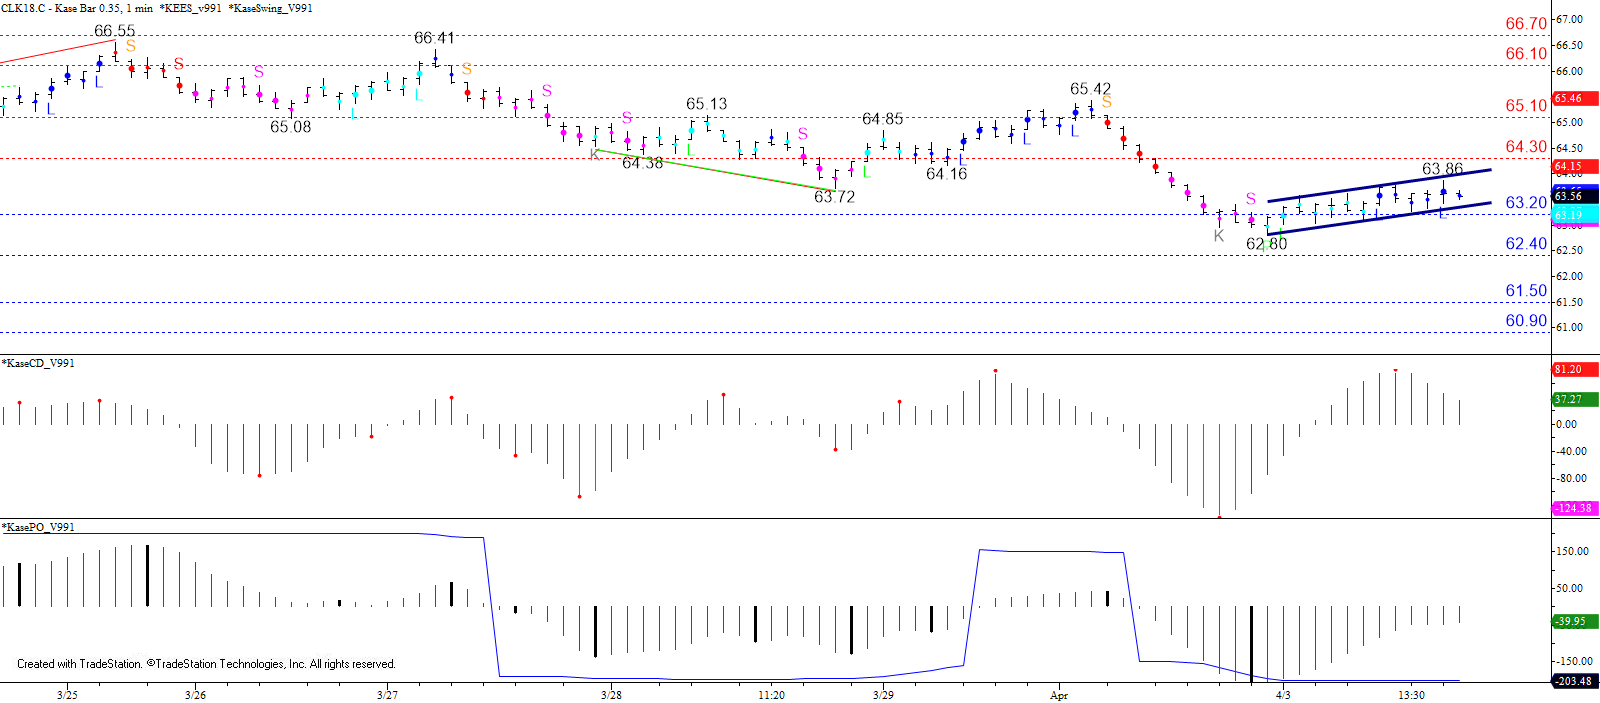
June WTI crude oil briefly broke lower out of the recent sideways trading range between nominally $67.1 and $69.5 when it fell to $66.85 today. The settle below April 18’s $67.58 midpoint indicates the near-term outlook is negative, though at this point prices will likely have to settle below $66.7 to confirm the downward correction is going to extend before prices eventually challenge the next major objective at $70.1.

WTI Crude Oil - Daily
WTI Crude Oil – Daily

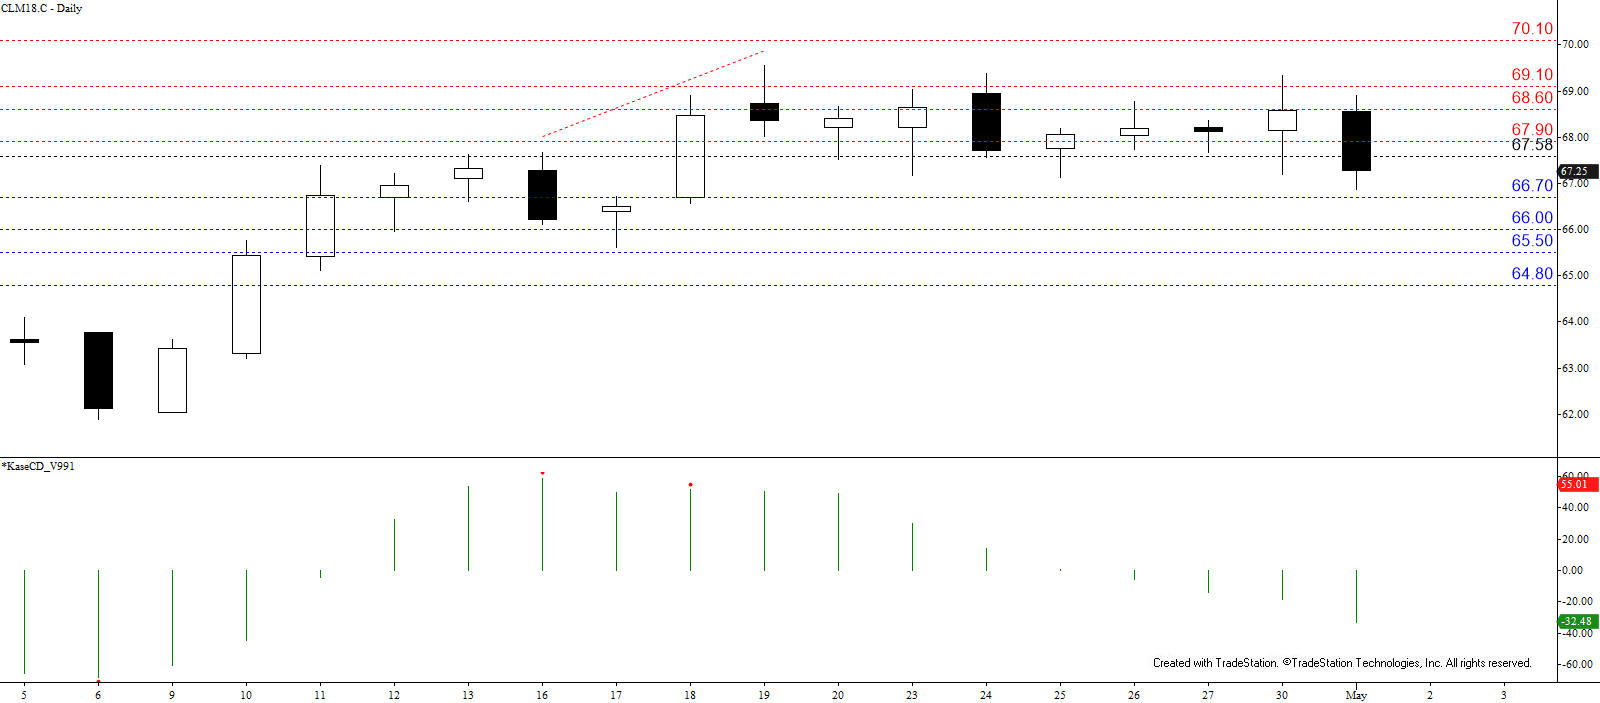
Tomorrow, look for a test of $66.7, a close below which would open the way for $66.0 and lower. Even then, WTI crude oil still has a long way to go before the long-term outlook becomes bearish, so any move down right now will most likely be corrective.

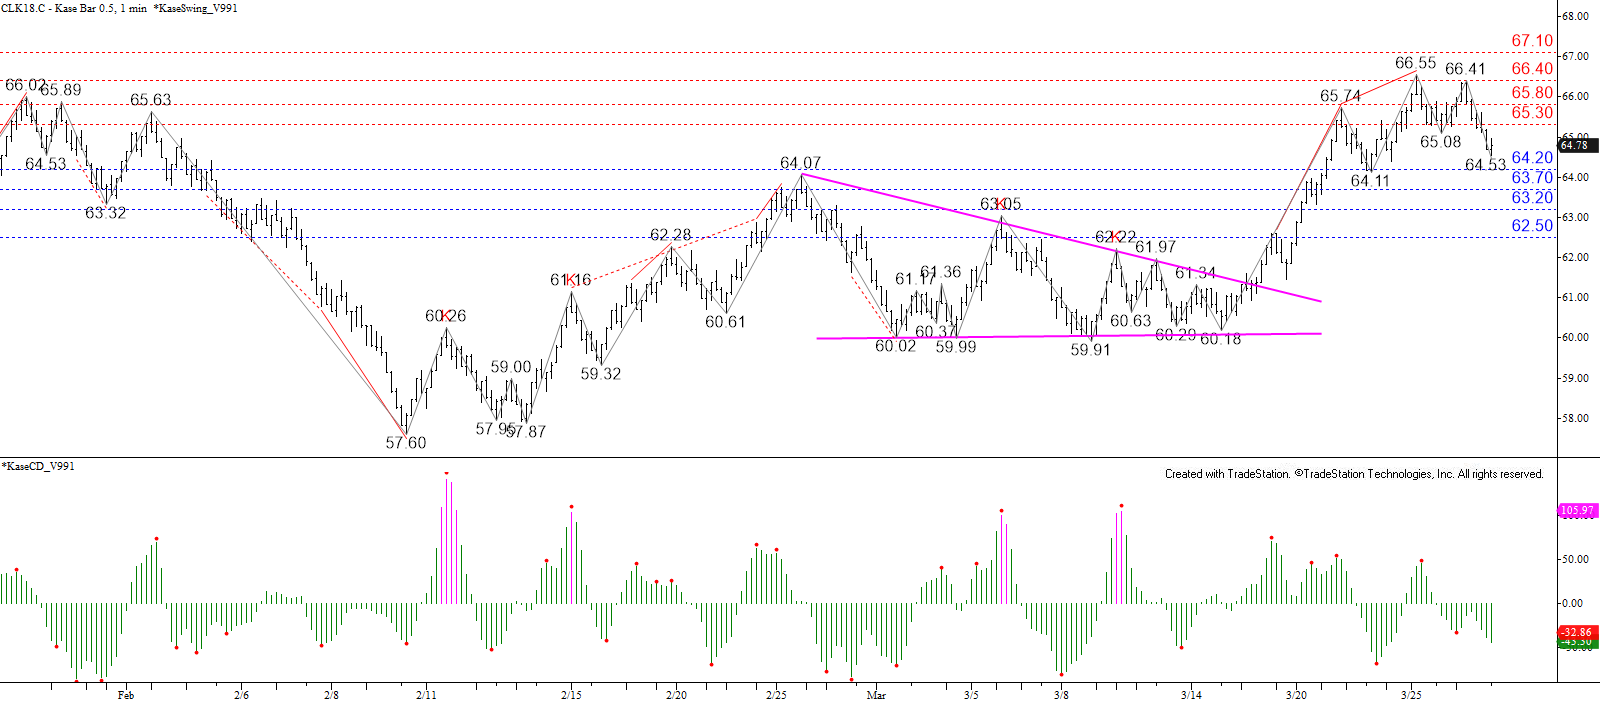
That said, prices settled just above the bottom of the recent trading range and the small wave formation up from $66.85 indicates a test of today’s $67.9 midpoint might take place first. A close above this would call for key near-term resistance at $68.6. For the downward correction to extend to $66.0 and lower this week $68.6 must hold. A close above this would shift near-term odds back in favor of $70.1.

This is a brief analysis for the next day or so. Our weekly Crude Oil Forecast and daily updates are much more detailed and thorough energy price forecasts that cover WTI, Brent, RBOB Gasoline, Diesel, and spreads. If you are interested in learning more, please sign up for a complimentary four-week trial

June natural gas remains range bound between nominally $2.65 and $2.87 but has been working its way toward the upper end of the range for the past few days. A test of $2.84 is expected early tomorrow but this level will probably hold as there is evidence the move up is exhausted and poised for another test of $2.78 and possibly lower.

June sustained a close over $2.79, the smaller than (0.618) target of the wave up from $2.66, for the past two days. The equal to target for this wave is $2.85, which is near $2.84, the 200-day moving average. Waves that meet the smaller than target generally extend to the equal to target. Therefore, there is a good chance for at least $2.84 early tomorrow. This is extremely strong and important resistance, so a close above $2.84 would be quite positive for the near-term. However, to prove June has broken out of the recent range a close above the $2.873 swing high is necessary. For now, such a move is not expected without help from external factors (i.e. another larger than expected withdrawal from storage).

Natural Gas - Daily
Natural Gas – Daily

That said, today’s early move up fulfilled the $2.825 equal to (1.00) target of the wave up from $2.691 and the subsequent pullback formed a daily hanging man reversal pattern. The hanging man and confirmed bearish intra-day divergences indicate the move up is exhausted and ready for another test of $2.78. This is the hanging man’s confirmation point, a close below which would open the way for another downward oscillation within the trading range to $2.75 and lower.

So, with all factors considered look for a move up to at least $2.84 and then for a test of $2.78 again within the next day or so. Settling beyond either of these levels should paint a clearer picture of next week’s outlook.

This is a brief analysis for the next day or so. Our weekly Natural Gas Commentary and daily updates are much more detailed and thorough energy price forecasts that cover key natural gas futures contracts, calendar spreads, the UNG ETF, and several electricity contracts. If you are interested in learning more, please sign up for a complimentary four-week trial.

June WTI crude oil failed to rise above the $69.55 swing high today after stalling at $69.38. The subsequent move down formed a bearish engulfing line and challenged the $67.6 completion point of the daily evening star and hanging man bearish reversal pattern that has been set up since April 19.

WTI Crude Oil - Daily Candlesticks
WTI Crude Oil – Daily Candlesticks

A weak bearish KaseCD and MACD divergence indicate the move down is most likely corrective but the move down is poised to extend to at least $67.1 and possibly $66.6 tomorrow. A close below the latter would confirm the evening star and hanging man and take out the 38 percent retracement of the move up from $61.86, opening the way for a larger correction before the move up continues.

After such an aggressive pullback, it is not uncommon to see a test of resistance overnight. Therefore, today’s $68.3 midpoint might be tested but should hold. Tomorrow’s key resistance level is $69.0, a close above which would wipe out the bearish engulfing line and negate the evening star and hammer pattern. This would, in turn, open the way for a test of resistance split around $70.0 at $69.8 and $70.2. Of these levels, $70.2 is most important.

This is a brief analysis for the next day or so. Our weekly Crude Oil Forecast and daily updates are much more detailed and thorough energy price forecasts that cover WTI, Brent, RBOB Gasoline, Diesel, and spreads. If you are interested in learning more, please sign up for a complimentary four-week trial.

In the bigger picture, natural gas remains range bound between nominally $2.60 and $2.84. However, last Friday’s break higher out of a bullish flag and test of resistance at $2.76 set prices up to test the upper end of the trading range this week. So far, though, prices have struggled to reach the upper end of the range and the last three days form stars. Two, including the most recent, are shooting stars and the third is a hanging man. All three stars are part of an evening star reversal pattern setup that would be completed by a close below $2.71.

Natural Gas - Daily
Natural Gas – Daily

Given the shooting stars, hanging man, evening star setup and several bearish intra-day momentum divergences near-term odds favor another test of $2.71. As stated, a close below this would complete the candlestick reversal pattern and open the way for the confirmation point near $2.68. This is key support for the near-term because it is also the 62 percent retracement of the move up from $2.621. Settling below $2.68 would open the way for another test of the bottom of the recent trading range at $2.60.

That said, trading has been erratic and so far $2.71 has held after being tested on Monday. Should prices rise above $2.78 first, look for another attempt at $2.81 and even $2.87, resistance levels split around the upper end of the range at $2.84.

This is a brief analysis for the next day or so. Our weekly Natural Gas Commentary and daily updates are much more detailed and thorough energy price forecasts that cover key natural gas futures contracts, calendar spreads, the UNG ETF, and several electricity contracts. If you are interested in learning more, please sign up for a complimentary four-week trial.

Natural gas is still oscillating within a range between nominally $2.60 and $2.80. Traders are likely waiting on external factors to push the market out of the range, so for now, erratic trading will most likely continue.

Prices briefly fell below the lower trend line of the bullish pennant (not a textbook example) that formed during the decline from $2.764. However, the move stalled at $2.621 before rising to $2.69 and forming an intra-day double-top. Due to this pattern and the settle below Tuesday’s midpoint and the 62 percent retracement of the decline from $2.726 near-term odds favor a test of $2.64 tomorrow. This is the intra-day double top’s target and the larger than target of the wave $2.69 – 2.667 – 2.69.

Natural Gas with Kase StatWare - 0.015 Kase Bar
Natural Gas with Kase StatWare – 0.015 Kase Bar

A close below $2.64 would call for $2.60 and lower, though given recent choppiness it would not be surprising to see $2.64 hold and for a test of $2.72 resistance to take place. This is near the upper trend line of the pennant. A close above this would call for $2.76 and possibly higher.

So, the market will most likely test a bit lower tomorrow before possibly challenging resistance again. But, with all factors considered, there is still no evidence that the market will break out of the trading range and determine a long-term direction.

This is a brief analysis for the next day or so. Our weekly Natural Gas Commentary and daily updates are much more detailed and thorough energy price forecasts that cover key natural gas futures contracts, calendar spreads, the UNG ETF, and several electricity contracts. If you are interested in learning more, please sign up for a complimentary four-week trial.

May WTI crude oil’s rise from the recent $61.81 swing low extended again today and is poised to continue. Monday’s bullish piercing pattern was confirmed by settling above Friday’s $63.7 open. There are also no reversal patterns or setups that indicate the move up will end. In addition, the $65.86 swing high fulfilled the smaller than target of the wave $59.91 – 66.55 – 61.81, so any pullback will most likely be corrective of a larger scale move up.

WTI Crude Oil - Daily with Kase StatWare
WTI Crude Oil – Daily with Kase StatWare

Upon a close over $65.9 look for next resistance at $66.5. This was the equal to target of the wave $57.6 – 64.07 – 59.91 and the level at which the move up stalled on March 26. So far, $66.5 has held on a closing basis, so if the move down is going to have any chance of continuing in the near-term $66.5 must hold. A close above this would open the way for at least $67.3 and likely higher.

Because the smaller than target of the wave up from $59.91 was met this afternoon a corrective pullback might take place first. Initial support is $65.0, though a test of today’s $64.4 midpoint would not be unusual. Support at $64.4 should hold, but the key level is $63.3. Settling below $63.3 would indicate the move up has stalled again and that another attempt to move lower is underway.

This is a brief analysis for the next day or so. Our weekly Crude Oil Forecast and daily updates are much more detailed and thorough energy price forecasts that cover WTI, Brent, RBOB Gasoline, Diesel, and spreads. If you are interested in learning more, please sign up for a complimentary four-week trial.

Natural gas continues to show signs that it has settled into a trading range between nominally $2.55 and $2.85. Trading will most likely remain erratic as the market awaits factors to push it out of the range. However, it may be awhile before such factors come forth as the market will be pressed to balance inventories that are well below the five-year average against strong production during the low demand spring shoulder months.

Quantitative factors are balanced and reflect the neutral near-term outlook. Today’s initial move lower held support at $2.67 before rising and challenging important resistance at $2.75. The subsequent pullback from $2.746 forms a long upper shadow on the daily candlestick and is poised to challenge $2.67 again tomorrow. The likelihood of a test of support was also accentuated by a confirmed bearish KaseCD divergence on the $0.015 Kase Bar chart. A close below $2.67 will call for $2.63, which connects to $2.59 and $2.56.

That said, trading will likely remain choppy and a close above $2.74 would open the way for $2.78. Settling above $2.78 would shift near-term odds in favor of challenging the top of the trading range around $2.85.

Natural Gas with Kase StatWare - 0.015 Kase Bar
Natural Gas with Kase StatWare – 0.015 Kase Bar

This is a brief analysis for the next day or so. Our weekly Natural Gas Commentary and daily updates are much more detailed and thorough energy price forecasts that cover key natural gas futures contracts, calendar spreads, the UNG ETF, and several electricity contracts. If you are interested in learning more, please sign up for a complimentary four-week trial.

WTI crude oil’s move up stalled near $66.4, the equal to (1.00) target of the primary wave up from $57.6 last week. The subsequent pullback initially looked corrective, forming four stars and settling the week above March 23’s open. However, the move down accelerated on Monday and is poised to challenge important support at $62.4 within the next day or so.

WTI Crude Oil - 0.35 Kase Bar
WTI Crude Oil – 0.35 Kase Bar

Today’s move up from $62.8 was shallow and choppy and forms a bearish flag. The flag’s lower trend line is nominally $63.2, which is also an important retracement and today’s midpoint. An early move below this tomorrow would confirm a break lower out of the flag and open the way for $62.4.

That said, should $63.2 hold and prices rise above the flag’s upper trend line around $64.3, look for a test of key resistance at $65.1. Settling above $65.1 would shift near-term odds back in favor of a larger scale move up with near-term targets at $66.1 and $66.7.

This is a brief analysis for the next day or so. Our weekly Crude Oil Forecast and daily updates are much more detailed and thorough energy price forecasts that cover WTI, Brent, RBOB Gasoline, Diesel, and spreads. If you are interested in learning more, please sign up for a complimentary four-week trial.

The long-term outlook for natural gas is negative but the May contract met and held support around its $2.60 swing low Monday. The subsequent move up is most likely corrective of a longer-term decline to challenge $2.55 and lower. Even so, there is some technical evidence that the move up could still extend to at least $2.75 before another test of $2.60 and lower takes place.

The upward correction from the $2.61 swing low stalled at $2.731 today before pulling back to $2.69. The pullback forms an intra-day bullish pennant, so there is still a good chance the upward correction will extend. However, prices will have to break higher out of the pennant tomorrow and settle above $2.75 soon if the move up is going to challenge $2.82 and eventually key resistance at $2.86.

May Natural Gas - Daily
May Natural Gas – Daily

A move below $2.67 early tomorrow would be a likely sign that the pennant has failed and that the move down will challenge the $2.60 swing low again. A close below this would call for key lower support at $2.55, which is the last level protecting the continuation chart’s $2.522 swing low.

This is a brief analysis for the next day or so. Our weekly Natural Gas Commentary and daily updates are much more detailed and thorough energy price forecasts that cover key natural gas futures contracts, calendar spreads, the UNG ETF, and several electricity contracts. If you are interested in learning more, please sign up for a complimentary four-week trial.

WTI crude oil stalled near crucial resistance at $66.4 Monday and confirmed an intra-day bearish KaseCD divergence. The subsequent pullback completed a bearish Harami line and star today by closing below Friday’s $65.08 midpoint. The pullback is most likely corrective but should test the Harami line and star’s confirmation point near $64.2 tomorrow. A close below this would call for a larger downward correction toward key near-term support at $62.5.

May WTI Crude Oil - 0.50 Kase Bar
May WTI Crude Oil – 0.50 Kase Bar

Tomorrow, look for initial resistance at $65.3 and then $65.8. The $65.8 level is expected to hold, though the near-term outlook would only become bullish again upon a close above $66.4. This is still a crucial resistance level for the wave structure up from $57.6 that connects to $67.1 and then the next major objective protecting the $70.0 level.

This is a brief analysis for the next day or so. Our weekly Crude Oil Forecast and daily updates are much more detailed and thorough energy price forecasts that cover WTI, Brent, RBOB Gasoline, Diesel, and spreads. If you are interested in learning more, please sign up for a complimentary four-week trial.