
December natural gas fulfilled the equal to (1.00) target of the wave $3.353 – 3.013 – 3.198 when it fell to $2.847 today. Aside from a few brief declines to targets around $2.75, support around $2.86 has been troublesome on the continuation chart since late June. Technical factors indicate this may prove to be strong support for the December contract too.
It is much too soon to definitively state that the move down is over or even that a major correction is underway. However, the small move up from $2.847 formed a daily morning star and hammer reversal pattern setup that would be completed upon a close over Tuesday’s $2.942 midpoint. This is also near the larger than (1.618) projection of the small intraday wave $2.847 – 2.896 – 2.866. Also, the KasePO and Slow Stochastic are oversold and setup for bullish reversal patterns. Even the RSI is nearly oversold.
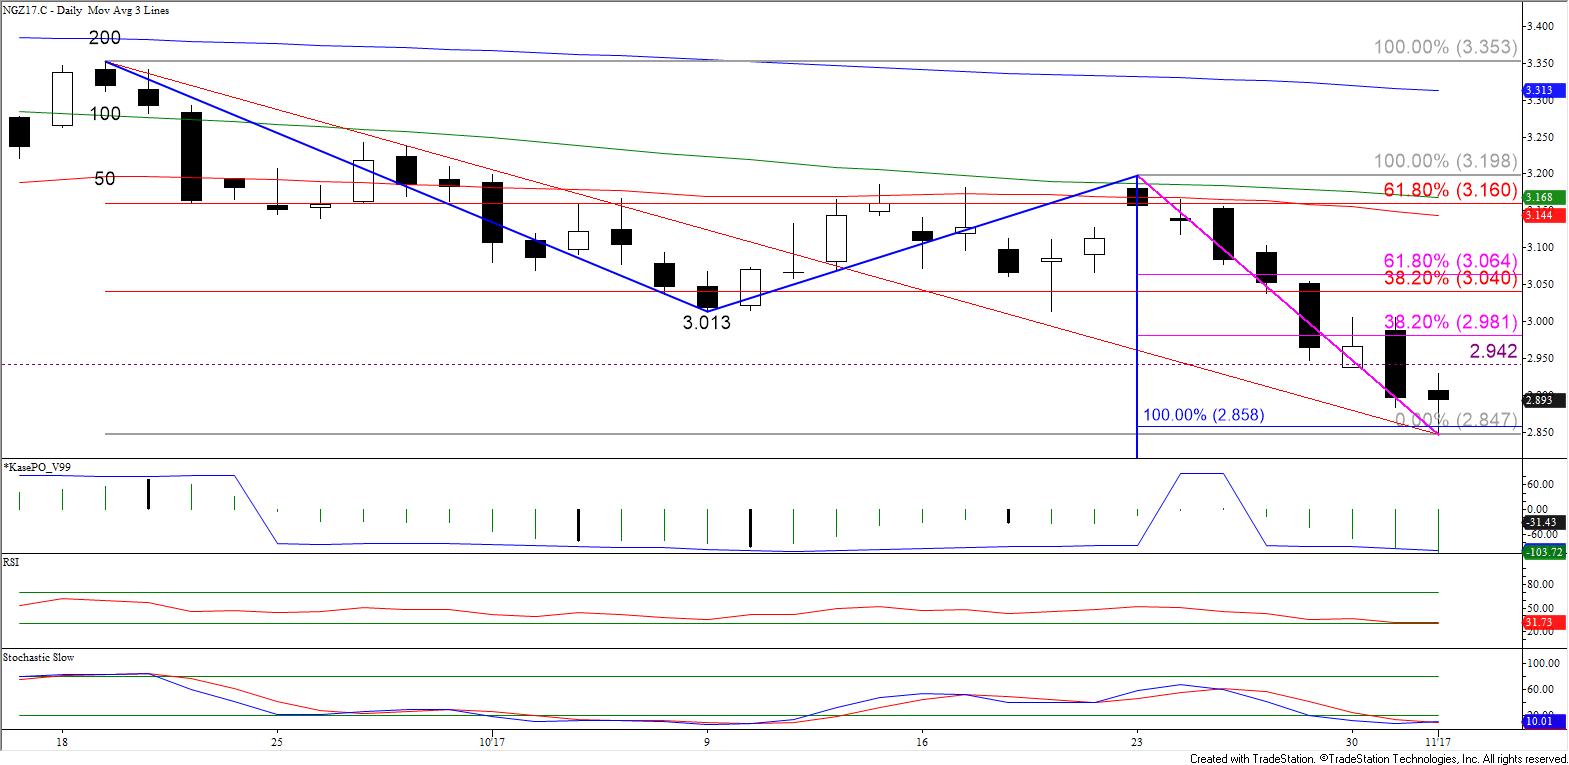
The challenge is that all of these positive factors are just setups at this point. Prices will need to settle above at least $2.95 to show that a meaningful correction is underway. Settling above $2.95 (more specifically, $2.945) would open the way for $2.99, the morning star and hammer’s confirmation point and the 38 percent retracement of the decline from $3.198 to $2.847.
If the move down is going to continue this week, a normal correction should hold $2.99. Otherwise, a close above this would call for a test of key near-term resistance at $3.05. This objective is split between the 62 percent retracement of the decline from $3.198 and the 38 percent retracement of the decline from $3.353. A close above $3.05 would not prove that the move down is over, but would provide a technical spark for a much more serious test of resistance that could ultimately lead to a recovery.
All of that said, the larger scale trend is still negative and longer-term odds ultimately favor a continued decline. Therefore, the anticipated move up to at least $2.95 and possibly higher will most likely be corrective. In addition, should prices fall below the $2.866, the wave up from $2.847 that projects to $2.95 and higher would be taken out. In this case, near-term odds will shift back in favor of $2.82 and ultimately $2.75, the next major objective below $2.86.
This is a brief analysis for the next day or so. Our weekly Natural Gas Commentary and daily updates are much more detailed and thorough energy price forecasts that cover key natural gas futures contracts, calendar spreads, the UNG ETF, and several electricity contracts. If you are interested in learning more, please sign up for a complimentary four-week trial.