WTI Crude Oil Technical Analysis and Short-Term Forecast
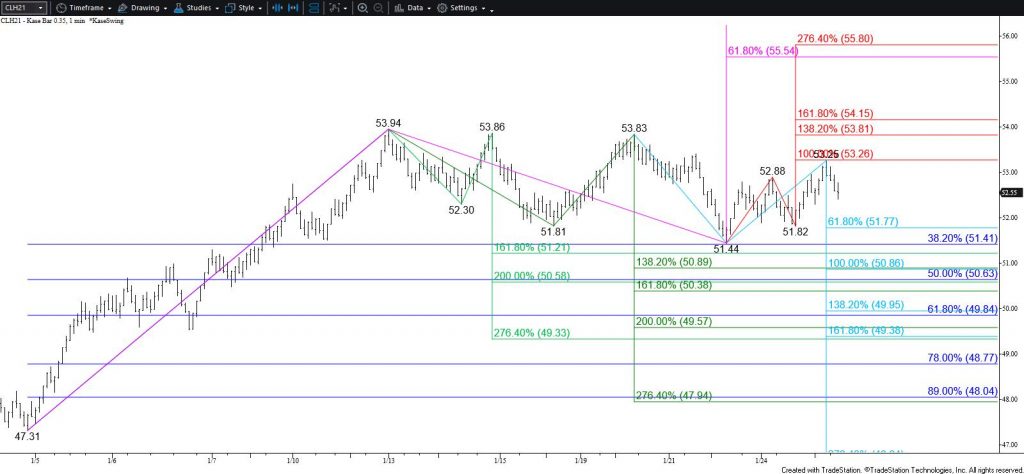
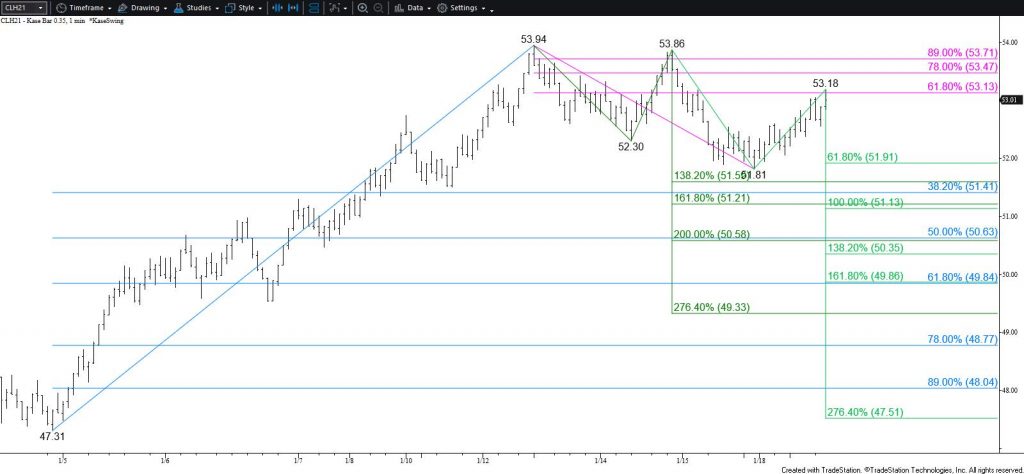
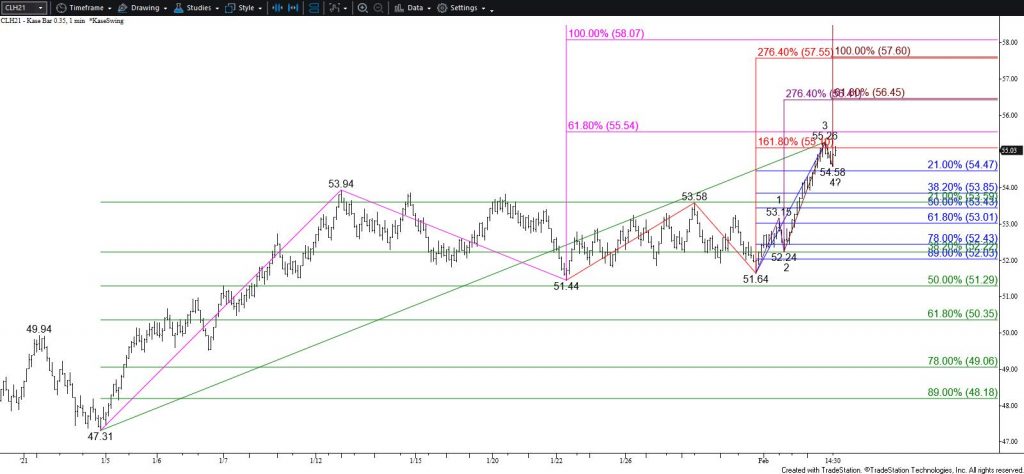
WTI crude oil rose as called for in Monday’s daily update and stalled just below the $55.4 target. The move up is still poised to extend and it now looks as though the rise from $51.64 is forming a small five-wave pattern that targets $56.5. This is the XC (2.764) target of Wave 1 and the smaller than (0.618) target of Wave 3. The $56.5 target is a potential stalling point, but any pullback from that level will likely prove to be a three-wave correction. This is because the larger wave structures favor $57.6 and higher upon a sustained close above $55.5.
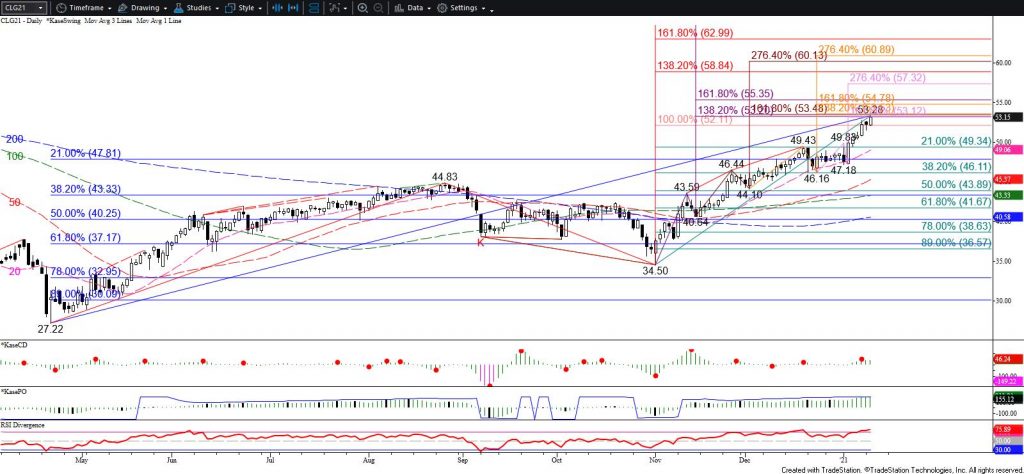
There are no bearish patterns or signals that call for a reversal. Even so, the daily RSI is overbought again and the KasePO, RSI, and Stochastic are setup for bearish divergence signals. To confirm these signals WTI will have to form both price and momentum peaks during the next few days, which is currently doubtful.
Nonetheless, should WTI take out $54.0 before rising much higher look for a test of key near-term support at $53.0. This is the 62 percent retracement of the rise from $51.64. Settling below $53.0 would reflect a bearish shift in the external factors that have driven WTI higher during the last few days and call for a deeper test of support with thresholds at $52.2 and $51.3.
This is a brief analysis for the next day or so. Our weekly Crude Oil Forecast and daily updates are much more detailed and thorough energy price forecasts that cover WTI, Brent, RBOB Gasoline, Diesel, and spreads. If you are interested in learning more, please sign up for a complimentary four-week trial.