
WTI Crude Oil Short-Term Price Forecast
WTI crude oil continues to trade in a choppy range that is bound within the upper half of the Bollinger Bands. A Bollinger squeeze trade setup in place, and because prices are trading above the 20-day moving average there is a good chance for a break higher out of the seven week-long upward sloping trading range. However, many bearish technical factors continue to call for a break lower out of the range and for a deeper correction before the move up ultimately continues.
In addition, today’s wave structure suggests that WTI will fall to challenge at least $42.3 early tomorrow. This is the equal to (1.00) target of the wave down from $43.29 and the 50 percent retracement of the rise from $41.33. Taking out $42.3 will call for a test of key near-term support at $41.8. This is the larger than target (1.618) of the wave down from $43.29, the smaller than (0.618) target of the wave down from $43.68, and is in line with the 20-day moving average.
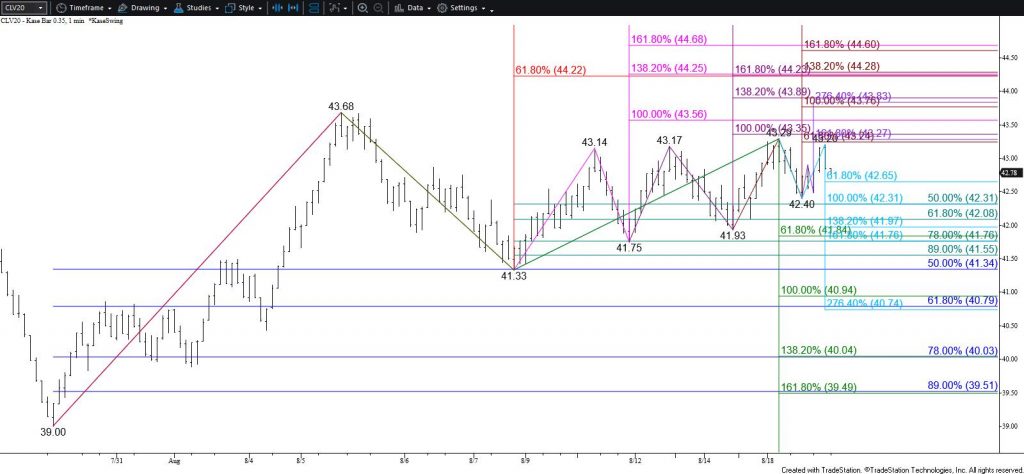
Based on recent trading patterns, settling below $41.8 may be a challenge, but this would clear the way for a test of $40.6. This is near the equal to target of the wave down from $43.68, the 50-day moving average, and the lower Bollinger band. Settling below $40.6 would confirm a break lower out of the trading range and clear the way for a much more significant test of support before the move up continues.
Nevertheless, should $42.3 hold early tomorrow there is still a good chance for a test of crucial resistance at $43.5. This is just above the upper Bollinger band and is in line with the 200-day moving average. Settling above $43.5 would call for $44.2, which then connects to $44.7 and $46.1.
Brent Crude Oil Short-Term Price Forecast
Brent crude oil is trading in the upper half of the Bollinger Bands, so there is still a good chance for a break higher out of the recent trading range. However, the wave formation for the past few days call for a test of $44.4 first. This is an important wave projection and retracement that is also in line with the 20-day moving average. Settling below $44.4 will call for a test of $43.8 and possibly $43.1. The $43.1 target is in line with the bottom Bollinger band and the 50-day moving average. Closing below this would call for a much more significant test of support before the move up ultimately continues.
Conversely, should $44.4 hold, look for a test of $45.7. This is near the upper Bollinger band. Settling above $45.7 would confirm a break higher and call for $46.4 and then $46.9. The latter level is in line with the 200-day moving average and is the barrier for a much more bullish outlook in the coming weeks.
This is a brief analysis for the next day or so. Our weekly Crude Oil Forecast and daily updates are much more detailed and thorough energy price forecasts that cover WTI, Brent, RBOB Gasoline, Diesel, and spreads. If you are interested in learning more, please sign up for a complimentary four-week trial