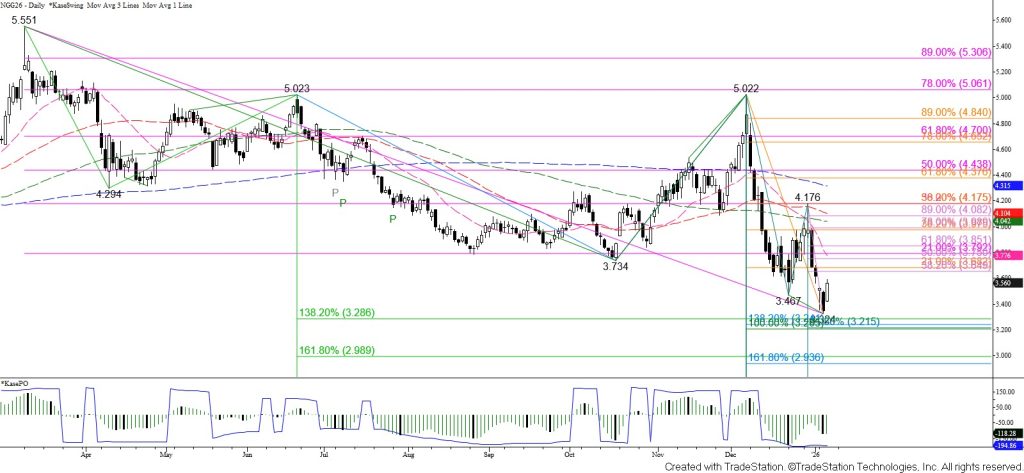
Gold Technical Analysis and Near-Term Outlook
This is a brief analysis for the next day or so. Our weekly Metals Commentary and daily updates are detailed and thorough price forecasts that cover key COMEX precious metals futures contracts and LME Non-Ferrous (Base) metals, spot gold, the gold/silver ratio, and metals ETFs. If you are interested in learning more, please sign up for a complimentary four-week trial.
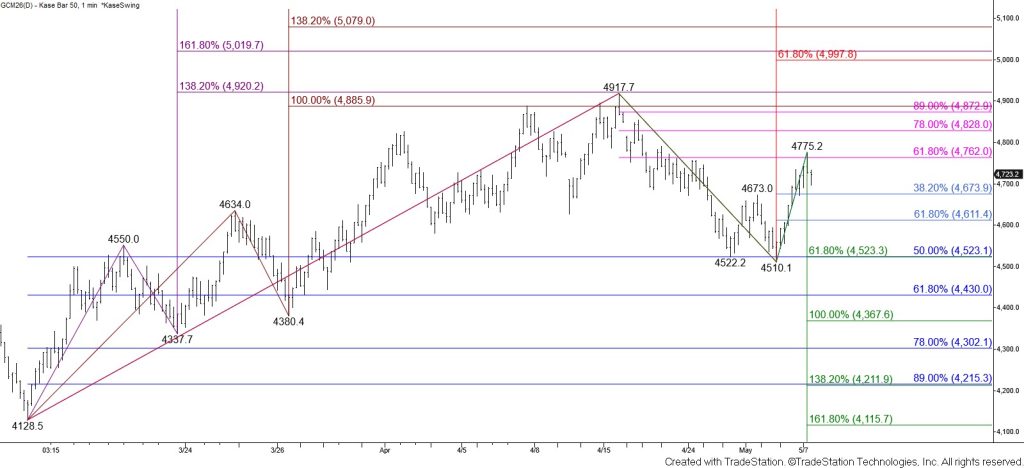
Gold’s follow-through after yesterday’s confirmation of a daily bullish Harami was lackluster. The 62 percent retracement from $4917.7 at $4762 and the 20-day moving average held on a closing basis. This warns that the move up from $4510.1 is the corrective leg of a wave down from $4917.7.
For now, the near-term outlook leans bullish given the confirmed Harami and the fact that the 50 percent retracement of the rise from $4128.5 at $4523 has held. Overcoming $4762 again will call for a test of $4816, which is in line with the 50- and 100-day moving averages. Settling above this will clear the way for another attempt to close above the highly confluent $4889 objective.
Nevertheless, this is a tight call for the near-term given today’s lackluster rise. Look for initial support at $4674 and then $4611. Taking out $4611, which is the 62 percent retracement of the rise from $4510.1, would call for another attempt to close below $4523, which is now the smaller than (0.618) target of the wave down from $4917.7. Settling below $4523 will put the near-term odds in favor of gold falling to $4430 and likely this wave’s $4368 equal to (1.00) target.