Natural Gas Technical Analysis and Near-Term Outlook
This is a brief analysis for the next day or so. Our weekly Natural Gas Commentary and daily updates are much more detailed and thorough energy price forecasts that cover key natural gas futures contracts, calendar spreads, the UNG ETF, and several electricity contracts. If you are interested in learning more, please sign up for a complimentary four-week trial.
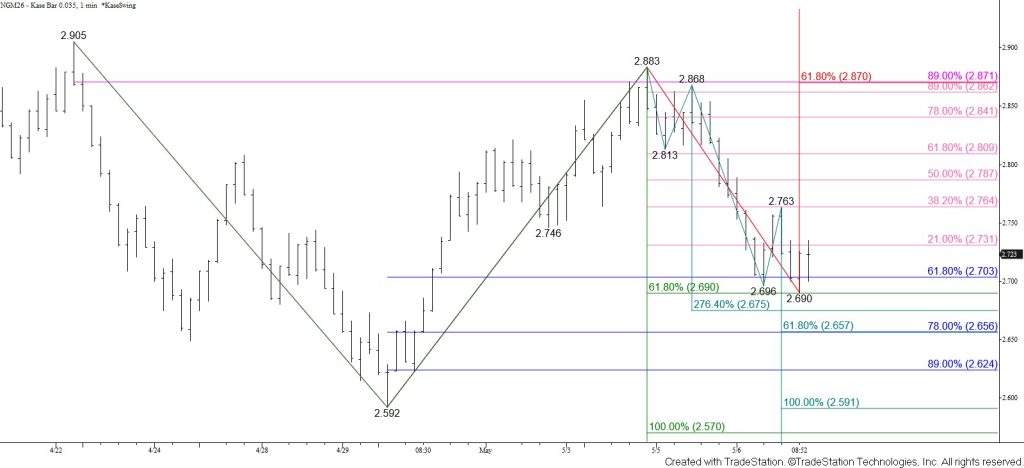
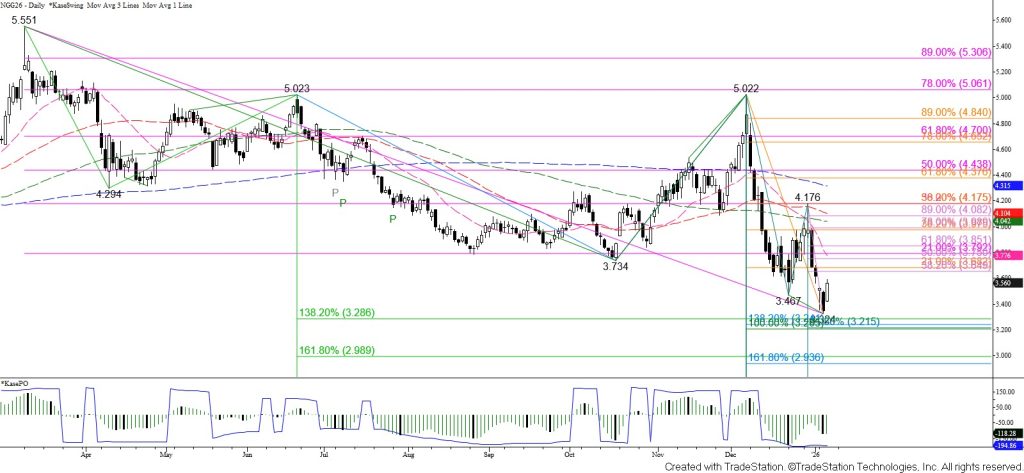
Natural gas took out the $2.746 swing low and invalidated all the prior waves up from $2.592 that had called for a continued rise. The 62 percent retracement of the rise from $2.592 at $2.70 and the $2.69 smaller than (0.618) target of the wave down from $2.905 held on a closing basis. Another test of $2.69 is favored, a close below which will imply that the corrective move up from $2.592 is complete. This will open the way for the $2.66 smaller than (0.618) target of the wave down from $2.868. This wave connects to $2.58 as the equal to (1.00) target. This is also the equal to target of the wave down from $2.905. Therefore, settling below $2.69 and then $2.66 will clear the way for a move below the confluent $2.62 target that was tested and held on a closing basis when prices fell to $2.592.
Nevertheless, because $2.69 held on a closing basis, there is still a modest chance for a continued rise. However, prices would have to close above $2.81 to put the near-term odds in favor of testing the $2.870 smaller than (0.618) target of the new primary wave up from $2.592. Settling above $2.87 will call for a test of this wave’s $2.98 equal to target.