WTI Crude Oil
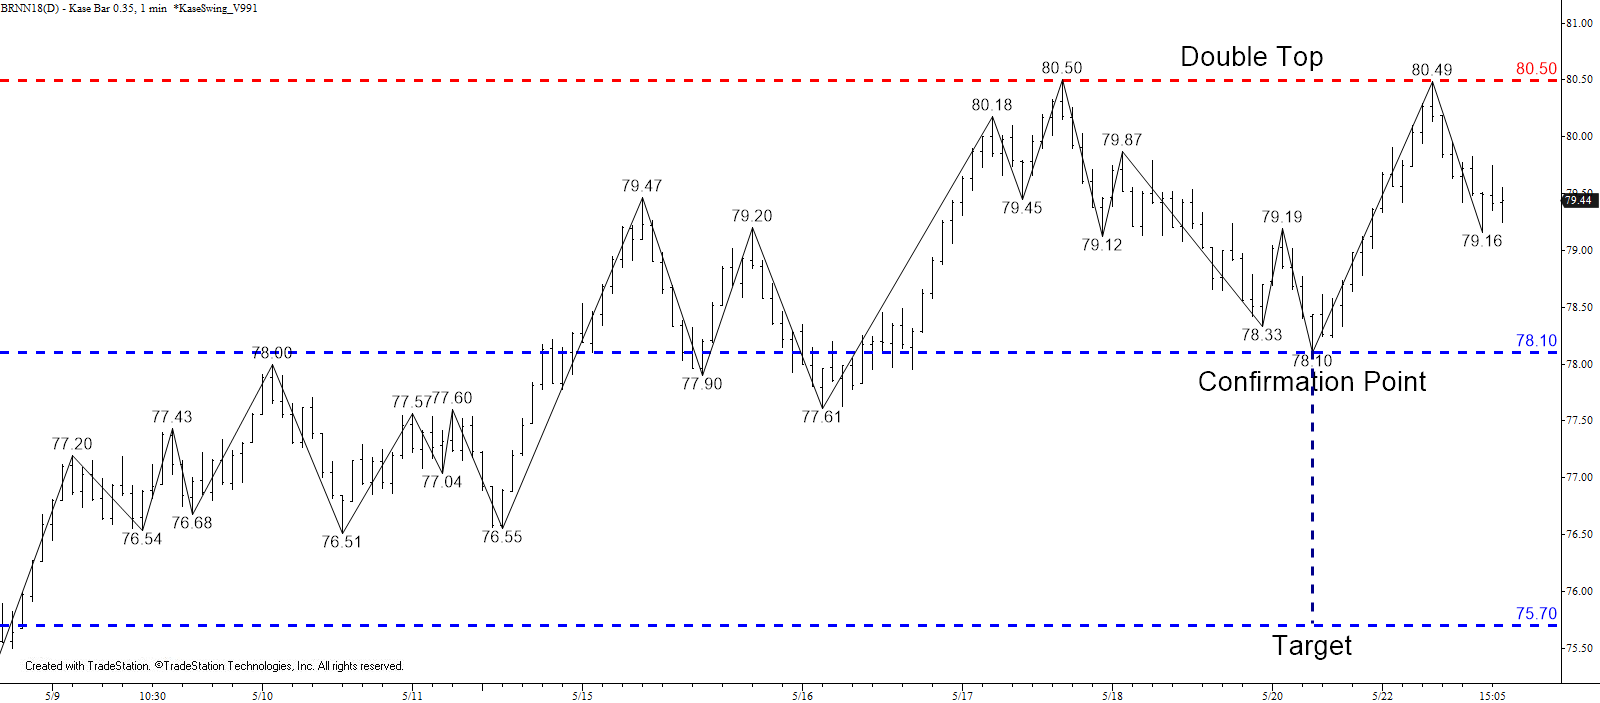
August WTI crude oil overcame yesterday’s intra-day double top and met this week’s initial $70.9 target. In addition, today’s settle above a key retracement of the decline from $72.7 indicates the move up is unfolding as a five-waves and that the $72.7 swing high will probably be tested before the end of the week. Even so, there are some factors that suggest the five-wave move might stall early tomorrow.
Today’s settle above the 62 percent of the decline from $72.7 and the larger than (1.618) projection of the wave $63.4 – 66.35 – 64.34 confirm the move up from $63.4 is a five-wave trend.
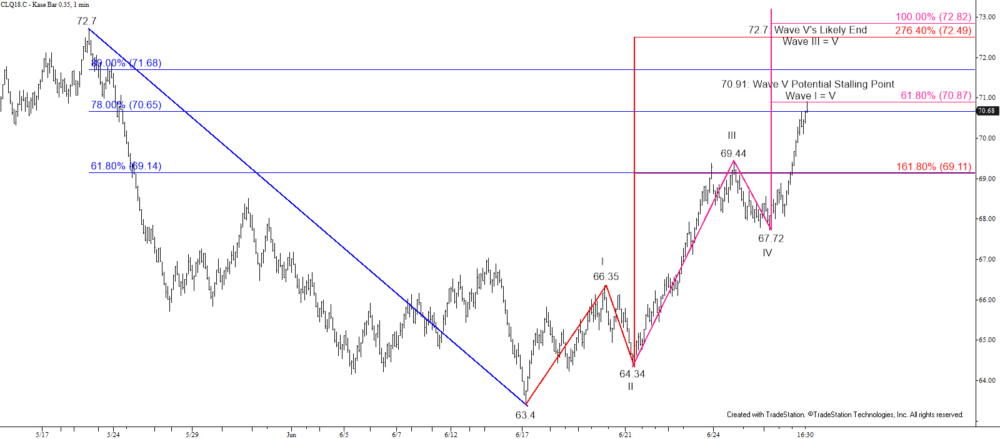
The chart shows that Wave V is already well underway and may have already met a stalling point at $70.91. This is because when a five-wave pattern forms at least two of the three impulse waves (I, III, V) should be equal. Currently, at $70.91, Waves I and V are equal, thus the possibility the move up will stall and begin to pullback early tomorrow. However, even though intra-day momentum is overbought, there are no confirmed reversal patterns that definitively state this will be the case. Therefore, near-term odds favor a continued rise.
With all factors considered, even if a small pullback to test today’s $69.4 midpoint takes place first, support will likely hold and the move up should then extend to $72.7. This is the highest that Wave I projects and the equal to (1.00) target of Wave III. Therefore, at $72.7 the move up would form a very classic looking five-wave pattern that would then be poised for a significant three-wave correction.
Regarding near-term support, $69.4 should hold, though the key level for tomorrow is today’s $68.21 open. Settling below this before $72.7 is met would be a strong indication that the five-wave pattern has ended and that another attempt at $67.3 and lower will ensue.
This is a brief analysis for the next day or so. Our weekly Crude Oil Forecast and daily updates are much more detailed and thorough energy price forecasts that cover WTI, Brent, RBOB Gasoline, Diesel, and spreads. If you are interested in learning more, please sign up for a complimentary four-week trial.