Natural Gas Technical Analysis and Near-Term Outlook
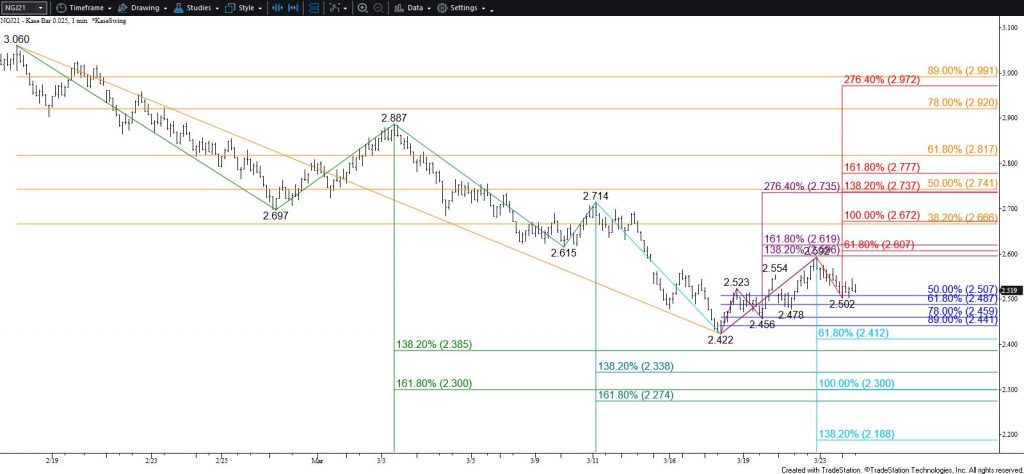
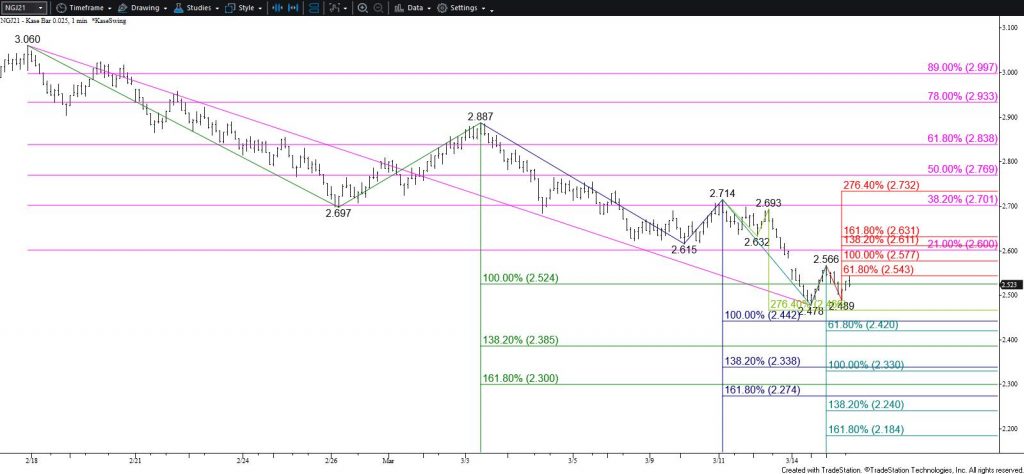
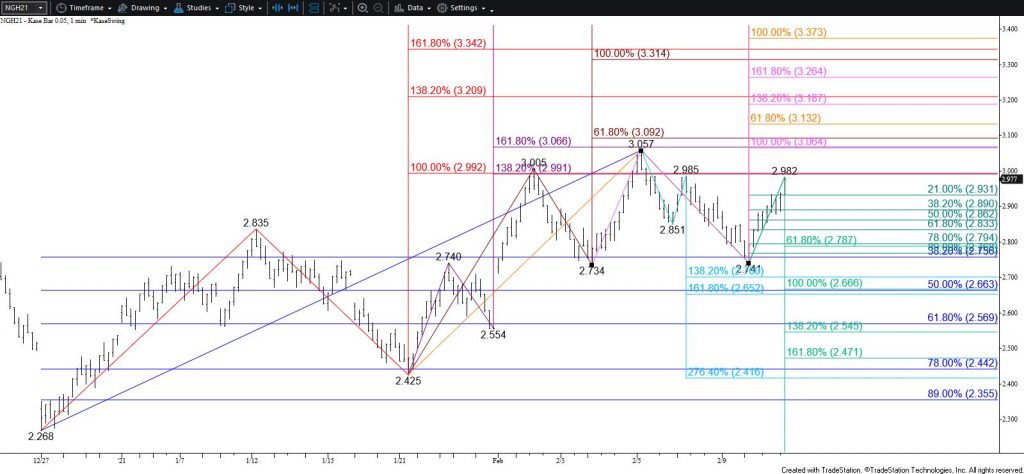
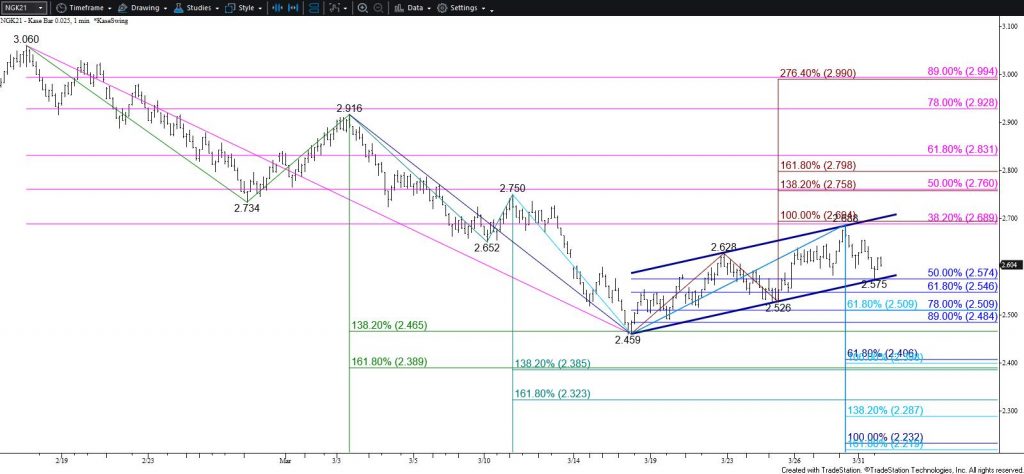
Natural gas retains a bearish outlook. The move up from $2.459 tested and held $2.69 resistance, which has helped to shape a bearish flag. This is a continuation pattern that is expected to break lower. The bottom trend line around $2.57 held today, but a close below this will confirm a break lower out of the flag and clear the way for $2.51. This then connects to $2.45 and lower.
Nevertheless, because $2.57 held today, there is a modest chance for another oscillation within the flag to test the upper trend line again. This is doubtful but a move above $2.65 will call for a test of $2.69 again. Settling above $2.69 would call for $2.73 and possibly $2.76, which would likely be in line with the flag’s upper trend line by the time prices rose that high.
This is a brief analysis for the next day or so. Our weekly Natural Gas Commentary and daily updates are much more detailed and thorough energy price forecasts that cover key natural gas futures contracts, calendar spreads, the UNG ETF, and several electricity contracts. If you are interested in learning more, please sign up for a complimentary four-week trial.