Natural Gas Technical Analysis and Near-Term Outlook
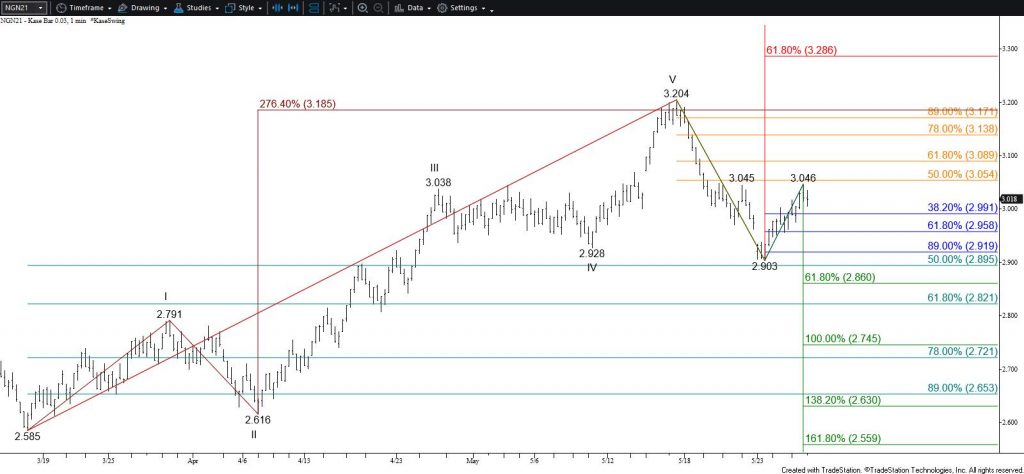
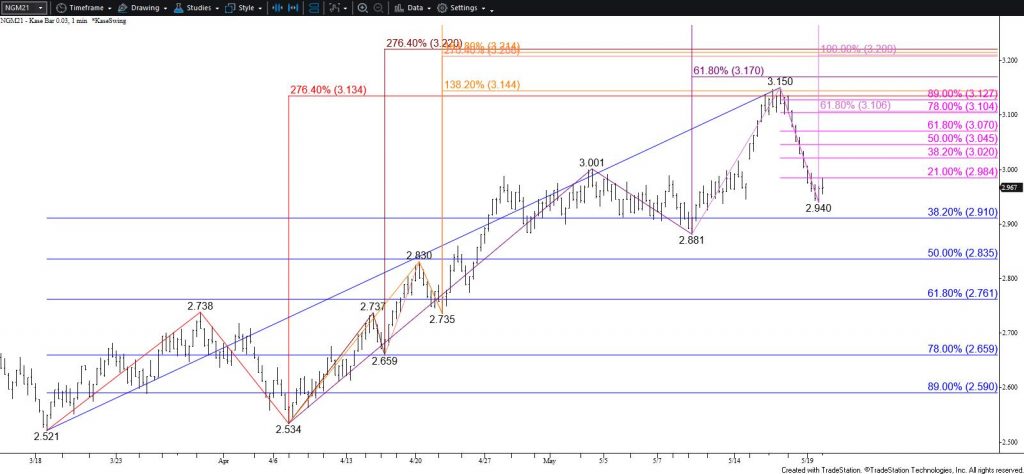
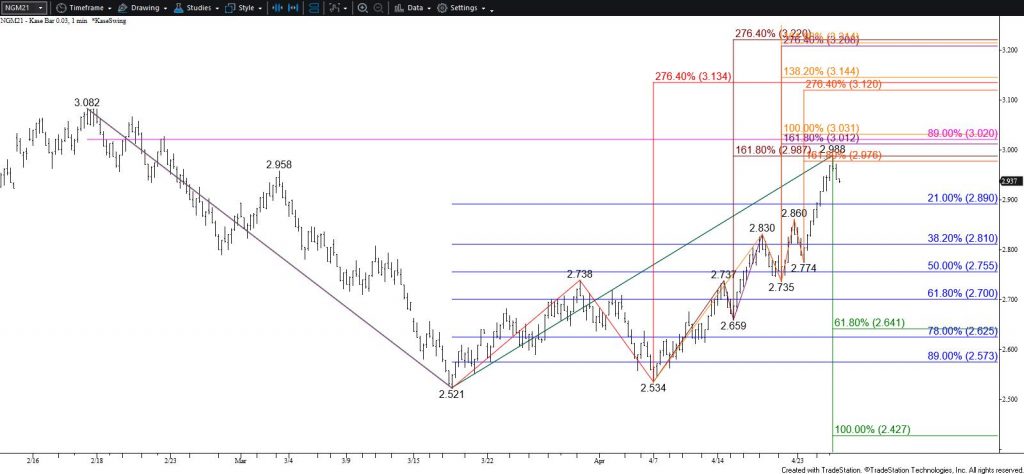
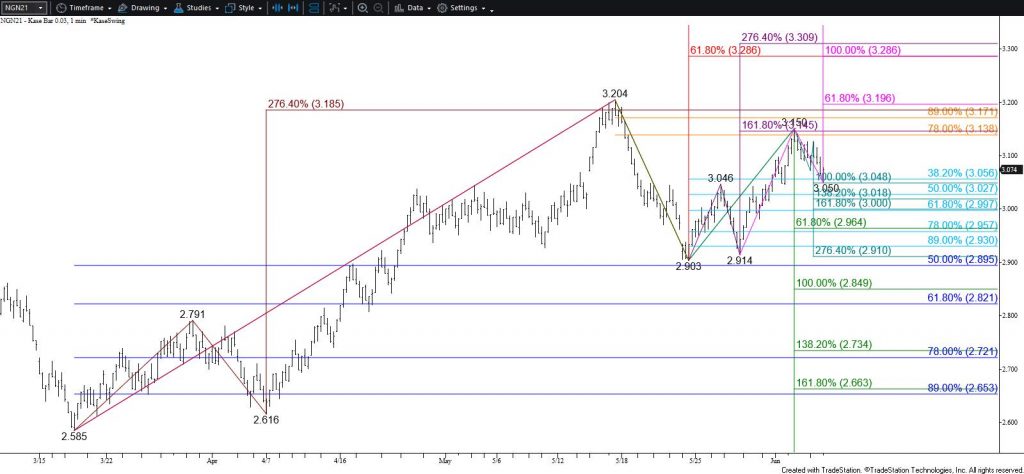
Natural gas pulled back a bit and formed an inside day. Yesterday’s $3.07 midpoint held on a closing basis but the wave down from $3.15 still has potential to extend. Trading will likely become more erratic during the next few days as the pullback still looks corrective. Near-term odds favor a continued rise, though they have been dampened. Overcoming $3.11 will call for a test of $3.16, a close above which will clear the way for a push toward $3.20 and higher.
Nevertheless, should the pullback from $3.15 extend first look for a test of $3.04 and possibly $3.00. Closing below $3.00 would imply that yesterday’s move up was another premature rally. In this scenario, prices could fall toward $2.96 and even $2.91 again, but overall, such a move would be reflective of natural gas settling into a wide trading range.
This is a brief analysis for the next day or so. Our weekly Natural Gas Commentary and daily updates are much more detailed and thorough energy price forecasts that cover key natural gas futures contracts, calendar spreads, the UNG ETF, and several electricity contracts. If you are interested in learning more, please sign up for a complimentary four-week trial.