Gold Technical Analysis and Near-Term Outlook
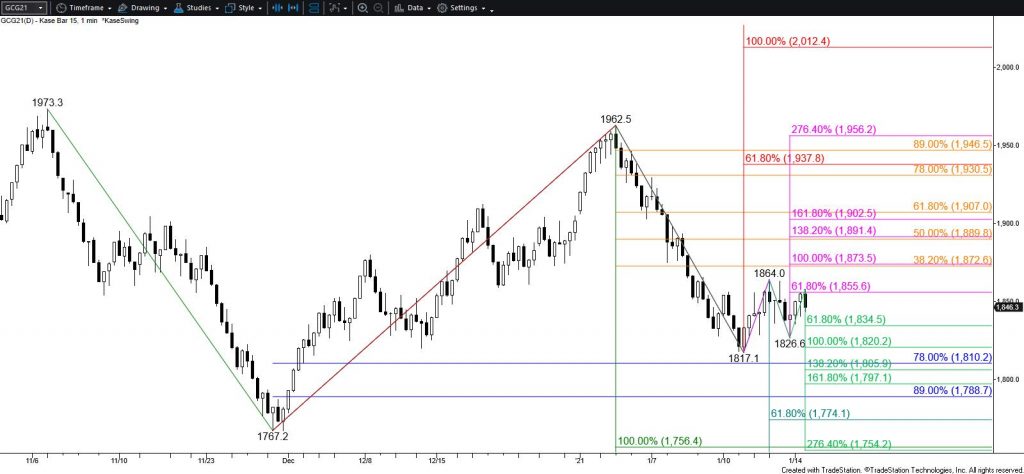
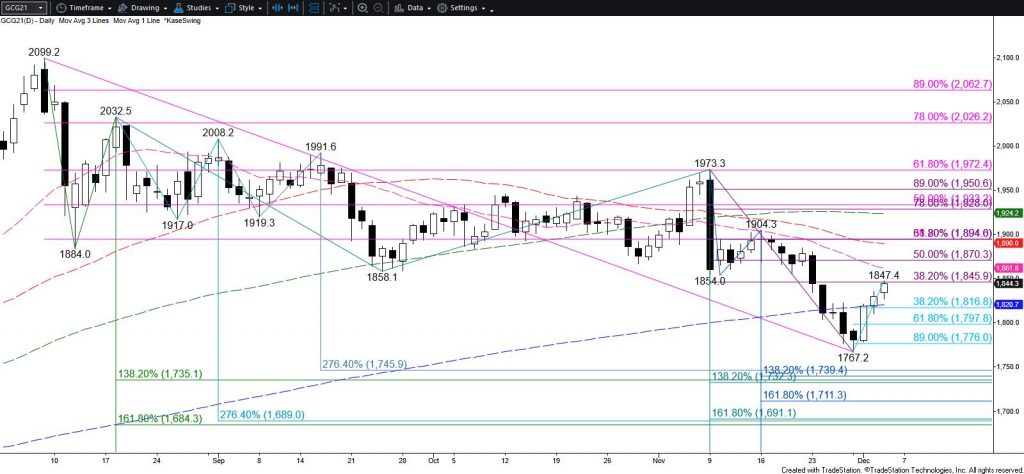
Gold gained a bit of bullish momentum for the near-term after rising above the $1864 swing high and settling back above the 200-day moving average yesterday. Furthermore, the wave up from $1800.8 fulfilled its $1866 smaller than (0.618) target. This is important because waves that meet the smaller than target generally fulfill their equal to (1.00) target, in this case, $1885. Settling above $1885 will call for a test of the $1905 intermediate (1.382) target, which is also in line with the 62 percent retracement of the decline from $1962.5.
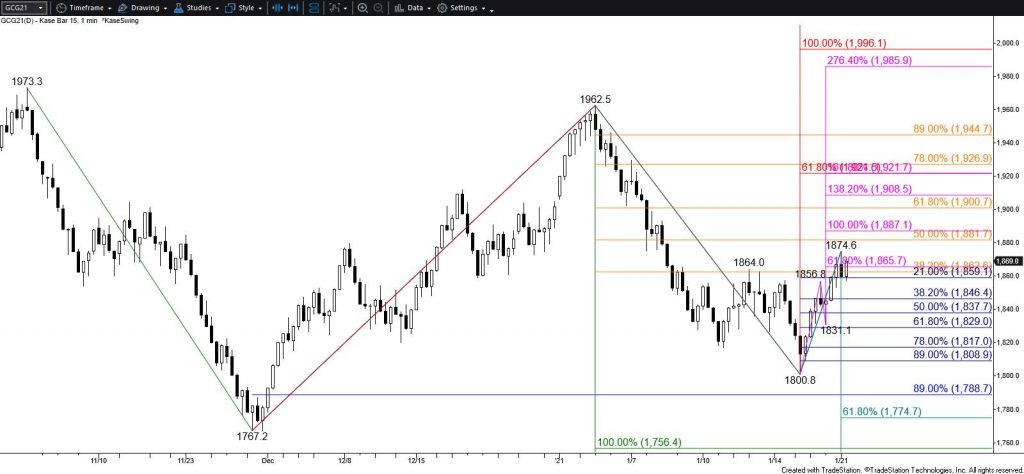
As stated in yesterday’s analysis, for the larger scale move down to retain a reasonable chance at extending $1905 must hold. Closing above $1905 would imply that gold is adopting a firmer bullish outlook and call for a test of $1922. This is the larger than (1.618) target of the wave up from $1800.8 and the smaller than target of the more important wave up from $1767.2.
Nevertheless, today’s lackluster follow-through after yesterday’s rally formed a daily hanging man. Normally, this type of pattern is most effective at predicting a reversal at the top of a long-term uptrend. Even so, today’s trading suggests the move up might still prove to be a short-lived correction. Falling below $1846 will call for key support at $1829. Closing below $1829 will confirm the hanging man and invalidate the wave up from $1800.8 that makes the connection to $1885 and higher.
This is a brief analysis for the next day or so. Our weekly Metals Commentary and daily updates are much more detailed and thorough energy price forecasts that cover key COMEX precious metals futures contracts and LME Non-Ferrous (Base) metals, spot gold, the gold/silver ratio, and gold ETFs. If you are interested in learning more, please sign up for a complimentary four-week trial.