How is Technical Analysis Used?

Technical analysis is technical. This means there are mathematics, charts, and statistics involved. Some interested in studying and using technical analysis are dismayed when they encounter numbers and charts. A math, engineering, science, or financial degree is not required to make use of technical analysis. However, an orientation towards structuring a view of reality mathematically is helpful.

Some people think technical analysis is a way to quickly make a lot of money, become a hotshot trader, or a means to finding the “Holy Grail” of trading systems. Technical analysis is certainly a means to success, but there is no way to get around the need for commitment and perseverance. Success in using technical analysis, like any endeavor, will take hard work, commitment, and perseverance.

The Four Aspects of Technical Analysis

When using technical analysis there are four basic applications: instrument selection, timing trade entries and exits, managing risk, and forecasting.

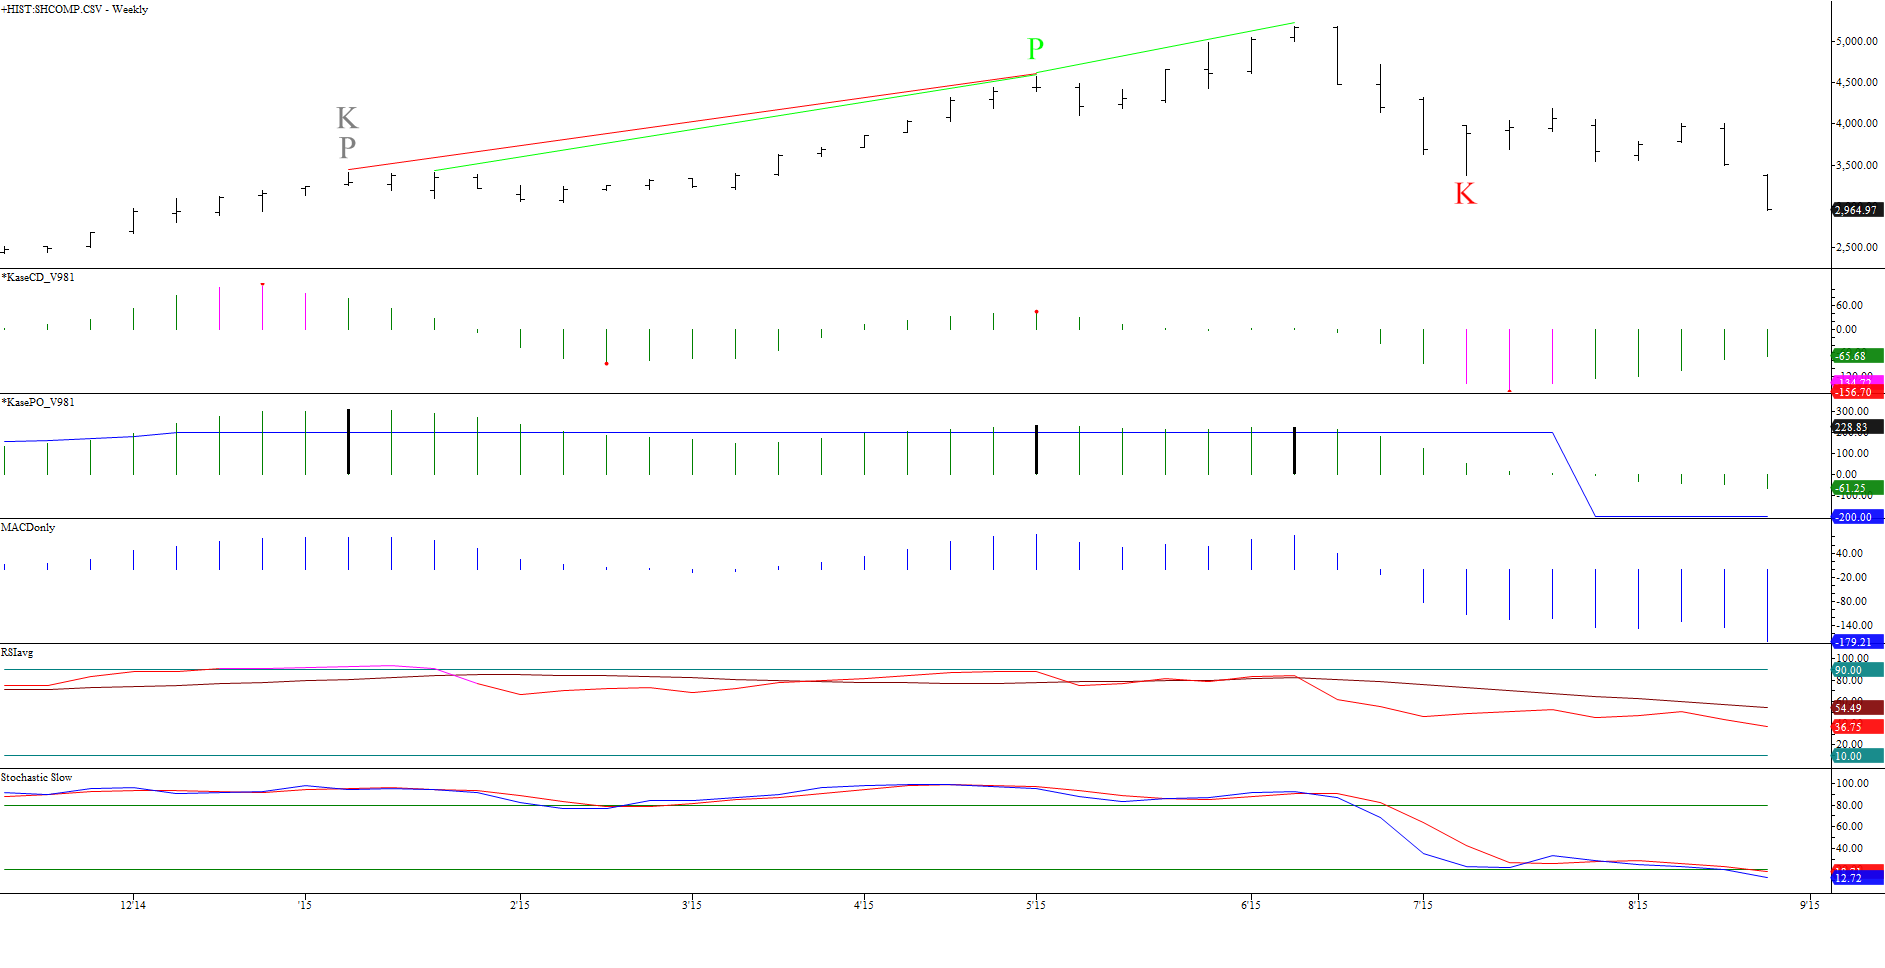
Technical analysis can be used to select instruments to trade. For instance, if a trader wanted to scan the 1,000 most active stocks and pick the instrument most likely to take a sharp turn, they could use technical momentum indicators such as the MACD or RSI to look for divergence. Divergence is a momentum signal that is triggered when a trend is exhausted. If a divergence occurs, it is likely that the instrument is getting ready to turn in a statistically significant manner. The trader can then decide to further analyze and possibly trade that instrument.

Once a trader has selected an instrument they can use technical analysis to determine the instrument’s direction, strength and extent of potential trends, support and resistance levels, potential turning points, and risk.

Technical analysis is, as the name implies, a study or examination of the market. The analogy commonly used in technical forecasting is that it is similar to cartography or map drawing. In other words, you are drawing a map of how to get from point A to point B.

Once the map has been drawn and the forecast is complete a trader can use technical indicators, geometric formations, and other methods of analysis to determine entry and exit point for the market. This is called market timing, and is one of the greatest strengths of technical analysis.

Example of Using Technical Analysis

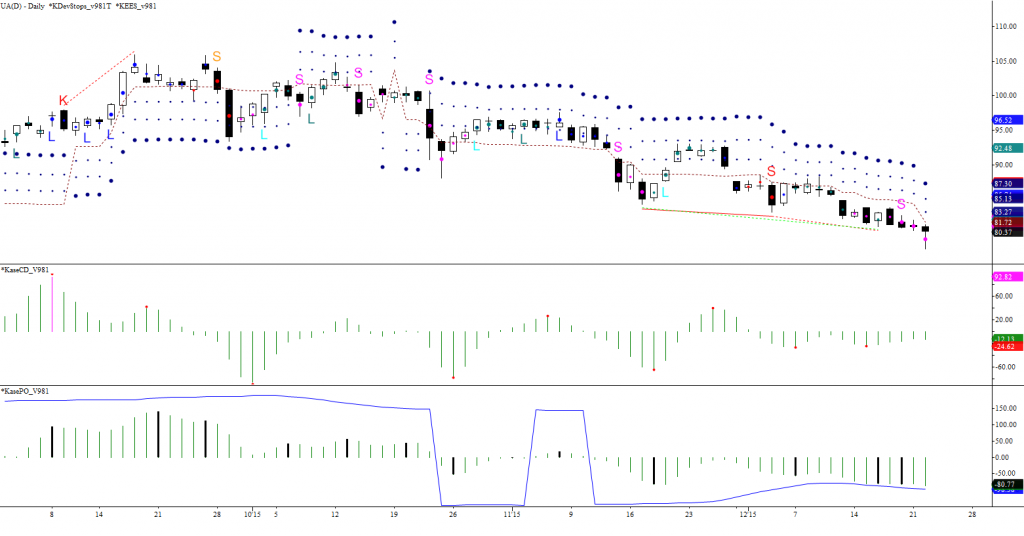
In the daily chart below as natural gas prices fell to new price swing lows the RSI momentum indicator was making higher lows. This was a clue that the decline was exhausted and that a significant turn higher was about to take place. A trader with a short position would possibly cover the positon once the divergence was confirmed (green trend lines).

NG Daily RSI Divergence

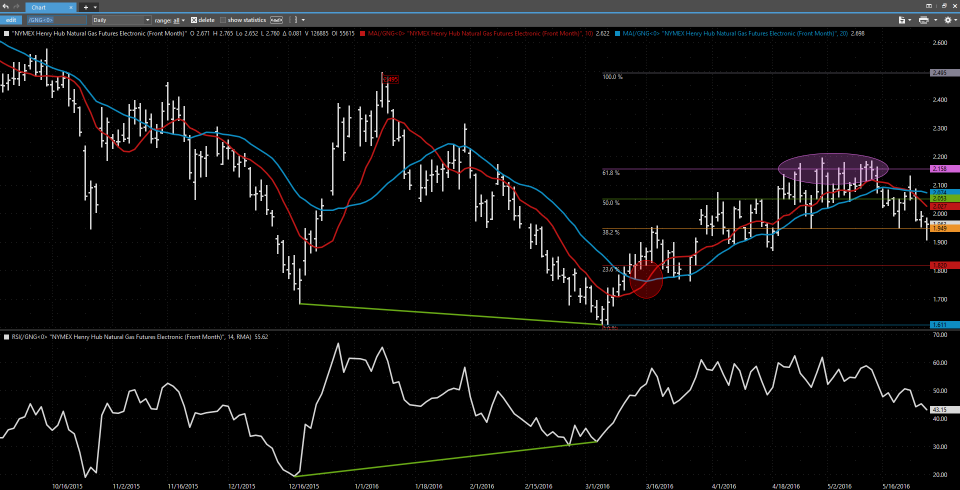
After covering the short trade, the trader could then time a long entry when the 10-period moving average (red line) crossed above the 20-period moving average (blue line). This crossover is shown within the red circle. When the fast moving average (10-period) rises above the slow moving average (20-period) it suggests the move up should continue because there has been an upward shift in momentum.

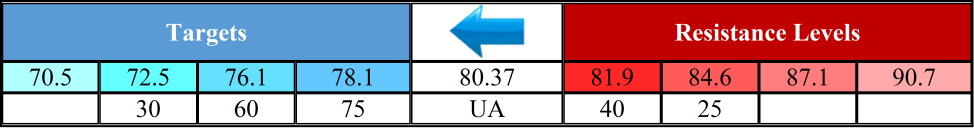
Once the long trade has been taken, the trader can then begin to identify resistance levels using other methods of technical analysis. In the example above, a series of Fibonacci retracements from the $2.495 swing high to the $1.611 swing low are shown to the right of the chart. The 38.2, 50, and 61.8 percent retracement levels of this move were identified as resistance well ahead of being met. Note that at each of these levels a small turn lower or trading range took place. Ultimately, the move up held near the 61.8 percent retracement (pink ellipse) and turned lower again.

Conclusion

Technical analysis is a means of analyzing and interpreting what the market knows about itself. As discussed, the tools within the practice of technical analysis are useful for instrument selection, timing trade entries and exits, managing risk, and forecasting. By learning and using technical analysis, one can become a better trader by gaining a deeper level of insight into the markets they trade.

Stock, commodity, foreign exchange, and fixed income markets are complex beasts that few can tame. There is no one right way to make trading decisions. When it comes to speculating on the direction of a given security traders generally have two ways of analyzing information and making trading decisions: fundamental analysis and technical analysis.

The first, and most traditional approach, is fundamental analysis. This is a broad topic and discipline. At the core, fundamental analysis revolves around the examination of supply/demand data, economic and financial data, and other qualitative and quantitative factors to determine the intrinsic value of a security. Fundamental analysis typically has a longer-term horizon, and is primarily used to make longer-term trading and investment decisions. In the long haul, the fundamentals rule.

The second approach, and the focus of this blog, is technical analysis. This is also a broad topic and is not as widely practiced as fundamental analysis. However, that is quickly changing.

The idea behind technical analysis is that all factors are discounted in price. If supply rises and demand falls, prices should go down. If there is a supply disruption, a popular new product, a positive quarterly earnings report, or even a positive “gut feel” traders will buy and when they do prices will go up. Essentially, technical analysis involves the reading and interpretation of price charts to make decisions of when to buy or sell, and whether or not prices will rise or fall. Technical analysis is very good for short term analysis and trading decisions.

The popularity of technical analysis is relatively new. The roots of modern day technical analysis date back to the days of Charles Dow, and Dow Theory. Some pundits even theorize that the Japanese used the basis of technical analysis to trade rice. However, the concepts of technical analysis were viewed as a voodoo like practice and shunned by most Wall Street trading houses, banks, and investment firms until the 1990’s.

Technical analysis has become very popular over the past three decades, and those with a firm grasp on both technical and fundamental analysis are in high demand. Today, most seasoned market analysts and traders recommend that both a fundamental and technical view be used. By doing so, a trader or analyst can harness the best of both worlds and create a very effective approach to determining market direction, trend strength, key support and resistance, and potential turning points. All of these factors can be used to create a reliable and effective trading strategy that will give you and your firm an advantage over competitors.

Spot Gold (XAU)
The long-term outlook for gold is still reasonably promising after prices rallied from a six-year low in December. However, from a technical standpoint, the decline from the 1263.48 swing high is poised to challenge support targets before the move up continues.

KaseX triggered a strong short entry signal called a pierced dart (gray down arrow and yellow triangle) on February 15. On that same day a bearish Harami line and star was completed. The subsequent pullback to 1240.02 held the 1263.48 swing high and was followed by a confirming short signal on Monday, February 22. Monday’s decline also completed another bearish Harami line and star. These factors call for the decline to continue for the near-term.

Gold Daily Candlestick ChartGold Chart

The primary wave that the move down formed, 1263.48 – 1191.02 – 1240.02, projects to 1194.5 as the 0.618 target. Most waves that meet the 0.618 projection extend to at least the 1.00 projection, which in this case is near the 1163.6 confluence point. 1163.6 is the decision point for a larger correction to 1126.2 and possibly lower. A close below 1163.6 would significantly dampen the likelihood of a continued rise, and a close below 1126.2 would shift the long-term outlook to negative.

Gold Table

First resistance is 1232.3. This is currently the 0.618 projection of the small wave up from 1191.02. A close over this would call for 1251.1, the 1.00 projection. As it stands, odds are 25 percent for a close over 1251.1 before at least 1194.5 is met. A close over 1251.1 would indicate that the move up should extend to at least 1277.1 and possibly 1331.0 and higher.

S&P 500 Index (SPX)

The S&P 500’s rally from a double bottom at 1810.1 has been relatively strong and is challenging the completion point of the formation at 1947.2. This is significant because a close over 1947.2 would complete the double bottom and open the way for a potential rally to the formation’s 2084.0 target.

S&P 500 Index Daily ChartSPX Chart

A similar double bottom had formed in late 2015 and was completed when the index closed over 2020.86. The ensuing move fell short of this double bottom’s 2177.0 target, but was still substantial. We could see a similar type of rally upon a close over 1947.2 that falls short of the 2084 target, but challenges key resistance before the decline continues.

Other technical factors, such as wave projections and retracements, call for at least 1971.6. This then connects to 2019.7, 2057.7, and finally 2084.

SPX Table

The move down stalled just below a key support level at 1849. This was the 1.00 projection of the wave 2134.72 – 1867.01 – 211.48. The index only closed for one day below this level, so this is still crucial support.

A normal correction of the move up should hold 1894.0 and must hold 1862. These are the 38 and 62 percent retracements from 1810.1 to 1946.7. Key support is 1848, and a close below this would shift the outlook back to negative and call for 1810 and lower again.

These are brief technical analyses with a 10-day outlook based upon Kase’s technical forecasting models and trading indicators KaseX and Kase StatWare. If you are interested in taking a trial of KaseX or Kase StatWare please contact sales@kaseco.com. We would love to get your thoughts about the forecasted targets and probabilities. Leave a comment or send them along with your request for a trial to sales@kaseco.com.

By Dean Rogers

Spot Gold (XAU)

The long-term outlook for gold is still reasonably promising after prices rallied from a six-year low in December. However, from a technical standpoint, the decline from the 1263.48 swing high is poised to challenge support targets before the move up continues.

KaseX triggered a strong short entry signal called a pierced dart (gray down arrow and yellow triangle) on February 15. On that same day a bearish Harami line and star was completed. The subsequent pullback to 1240.02 held the 1263.48 swing high and was followed by a confirming short signal on Monday, February 22. Monday’s decline also completed another bearish Harami line and star. These factors call for the decline to continue for the near-term.

Gold Daily Candlestick ChartGold Chart

The primary wave that the move down formed, 1263.48 – 1191.02 – 1240.02, projects to 1194.5 as the 0.618 target. Most waves that meet the 0.618 projection extend to at least the 1.00 projection, which in this case is near the 1163.6 confluence point. 1163.6 is the decision point for a larger correction to 1126.2 and possibly lower. A close below 1163.6 would significantly dampen the likelihood of a continued rise, and a close below 1126.2 would shift the long-term outlook to negative.

Gold Table

First resistance is 1232.3. This is currently the 0.618 projection of the small wave up from 1191.02. A close over this would call for 1251.1, the 1.00 projection. As it stands, odds are 25 percent for a close over 1251.1 before at least 1194.5 is met. A close over 1251.1 would indicate that the move up should extend to at least 1277.1 and possibly 1331.0 and higher.

S&P 500 Index (SPX)

The S&P 500’s rally from a double bottom at 1810.1 has been relatively strong and is challenging the completion point of the formation at 1947.2. This is significant because a close over 1947.2 would complete the double bottom and open the way for a potential rally to the formation’s 2084.0 target.

S&P 500 Index Daily ChartSPX Chart

A similar double bottom had formed in late 2015 and was completed when the index closed over 2020.86. The ensuing move fell short of this double bottom’s 2177.0 target, but was still substantial. We could see a similar type of rally upon a close over 1947.2 that falls short of the 2084 target, but challenges key resistance before the decline continues.

Other technical factors, such as wave projections and retracements, call for at least 1971.6. This then connects to 2019.7, 2057.7, and finally 2084.

SPX Table

The move down stalled just below a key support level at 1849. This was the 1.00 projection of the wave 2134.72 – 1867.01 – 211.48. The index only closed for one day below this level, so this is still crucial support.

A normal correction of the move up should hold 1894.0 and must hold 1862. These are the 38 and 62 percent retracements from 1810.1 to 1946.7. Key support is 1848, and a close below this would shift the outlook back to negative and call for 1810 and lower again.

These are brief technical analyses with a 10-day outlook based upon Kase’s technical forecasting models and trading indicators KaseX and Kase StatWare. If you are interested in taking a trial of KaseX or Kase StatWare please contact sales@kaseco.com. We would love to get your thoughts about the forecasted targets and probabilities. Leave a comment or send them along with your request for a trial to sales@kaseco.com.

By Dean Rogers

S&P 500 Index (SPX)

It has been a rough start for investors and the stock market so far this year. Falling oil prices and a weak economic outlook for China have soured the outlook for global markets and have indices across the world testing major support.

The technical outlook for the S&P 500 Index is negative. The index fell below its late August 2015 1867.01 swing low and has challenged major support at 1842 for the past few days. A few weeks ago we call for the S&P to test 1842 because of its confluence as a projection for major waves down from 2134.72 and 2116.48. This extremely important 1842 target was taken out by the 1812.29 swing low, but the index has not settled below 1842 yet.

Daily S&P 500 Index with KaseXSPX 20160121

The 1842 target has been adjusted to 1845 based upon the new wave formations and retracements. A sustained close below 1845 could open the way for the decline to continue to at least 1771 and ultimately 1688 as indicated in the table below.

SPX-Table


The confluence of 1842 makes it a potential stalling point, and at minimum, a correction will likely take place before the move down continues. Resistance at 1910 should hold, but the key level for the near-term is 1938. A close over 1938 would not mean that the move down is over, but would rather call for an extended upward correction to 1986 and possibly 2056. A close over the latter would be bullish for the long-term outlook.

10-Year T-Note Futures (TY)

As stock prices have fallen some monetary funds have been shifting into fixed income. As a result, 10-Year T-Note futures have risen substantially in recent weeks. The move up is poised to continue, but several negative technical factors indicate a correction should take place first.

An important resistance level at 128’19 was overcome earlier this week. This was the 0.618 projection for the wave 124’19 – 130’00.5 – 124’14. Kase’s wave analysis studies show that once the 0.618 projection is met most waves will extend to at least the 1.00 projection, in this case 130’17. This is near our model’s confluence point of 130’0 and the most recent major swing high. A sustained close over 130’0 would call for 131’20 and very likely 132’16.

TY-Table


The retracements of the move up from 125’14 to 129’08 define crucial support levels in coming weeks. As stated, a correction is expected, and a normal correction should hold 127’25.5. A close below this would call for an extended correction to key support at 126’25.5. If the move up is going to have any chance at continuing in coming weeks 126’25.5 must hold.

Daily Continuation 10-Year T-Note Futures with KaseXTY1 20160121

These are brief technical analyses based upon Kase’s technical forecasting models and trading indicators KaseX and Kase StatWare. If you are interested in taking a trial of KaseX or Kase StatWare please contact sales@kaseco.com. We would love to get your thoughts about the forecasted targets and probabilities. Leave a comment or send them along with your request for a trial to sales@kaseco.com.

S&P 500 Index (SPX)

By Dean Rogers

The slowing Chinese economy, lackluster manufacturing data, and a weaker yuan have sent Chinese stocks tumbling in the first week of 2016. China’s stock market has been halted twice this week when volatility limits were reached and is down seven percent over the last few days. The selloff has spilled over into global markets as the Dow Jones Industrial Average and S&P 500 Index are off to their worst starts for a year ever.

The S&P 500 Index (SPX) charts reflect the near-term negative tone. Several factors indicate the decline should challenge support levels below August’s 1867.01 low at 1842. This will be a crucial decision point for a much more bearish outlook and sustained decline over the next several weeks and possibly months.

The table below shows SPX targets and resistance levels and the associated probabilities for meeting those targets and levels within the next 10 trading days. Kase’s technical forecasting models indicate odds are 80 percent for at least 1900 and 65 percent for 1842. The latter is the bearish decision point and will probably hold, at least initially.

SPX-Table

January 7’s close below the 62 percent retracement of the move up from 1867.01 to 2116.48 has shifted odds in favor of a continued decline. In addition, the 0.618 projection of the primary wave 2134.72 – 1867.01 – 2116.48 has been taken out by January 7’s close. Waves that close below the 0.618 projection generally extend to at least the 1.00 projection, in this case 1842 (+/- 7 points). Therefore, the SPX should fall to 1842 before a significant upward correction takes place. A close below 1842 would call for 1744 as the 1.382 projection for the wave down from 2134.72 with an intermediate confluence point at 1788.

SPX Daily with KaseXSPX-Daily

First resistance is 2006, the 38 percent retracement of the decline from 2116.48 to 1938.83. This level will most likely hold upon a correction. The key level for the near term is 2048, the 62 percent retracement. A close over 2048 would indicate the move down is most likely over and that the SPX will push towards at least 2093 which connects to 2184. A close over 2048 has 35 percent odds and a close over 2093 has 20 percent odds.

KaseX confirms the move down on the weekly chart. The recent overbought signal (gray arrow) and unfiltered short entries (pink triangles) indicate the decline should continue. On the daily chart, for those that are not already short, KaseX shows that it would be prudent to wait for a pullback and another confirmed sell signal (pink or purple triangle) after the recent short warning (yellow triangle).

SPX Weekly with KaseXSPX-Weekly

With all factors considered, the move down should continue and test the 1842 decision point in coming weeks. There is not enough technical evidence yet to definitively state that 1842 will hold. However, because of its importance, at a minimum, we expect at least a small upward correction to take place from 1842 once this target is met. Sustaining a close below 1842 would be extremely bearish for the long-term and could be the precursor to a bearish 2016.

This is a brief technical analysis of the S&P 500 Index based upon Kase’s technical forecasting models and trading indicator KaseX. If you are interested in taking a trial of KaseX please contact sales@kaseco.com. We would love to get your thoughts about the forecasted targets and probabilities. Leave a comment or send them along with your request for a trial to sales@kaseco.com.

Walt Disney Co. (DIS)

By Dean Rogers

“Well, the Force is what gives a Jedi his power. It’s an energy field created by all living things. It surrounds us and penetrates us; it binds the galaxy together.” You may think that I am referring to the legendary words spoken by Obi-Wan Kenobi to Luke Skywalker while teaching him the ways of the Jedi in “Star Wars” (later retitled “Star Wars Episode IV: A New Hope”). However, I refer to that quote because Walt Disney Co. has made the essence of Obi-Wan Kenobi’s statement about the Force the mantra of their capitalization on the Star Wars brand after acquiring Lucasfilm in 2012 for $4.06 billion.

For the past several months, and likely for the next several years, everywhere you look Star Wars branded items from toys, to clothing, to cars, and even makeup, surround us, penetrate us, and binds Disney’s marketing efforts together. I call it the “Essence of the Force Strategy”.

So far, Walt Disney Co.’s strategy has worked, and it has worked well. “Star Wars Episode VII: The Force Awakens” has already shattered world-wide box office records and has brought in over $1 billion since its opening in the U.S., and some think that it will bring in $1-2 billion more after its opening in China on January 9. Those figures will not even scratch the surface of what is to come from the Star Wars brand for Walt Disney Co. in merchandise sales, Episodes VIII and IX, and the expansion movies like “Star Wars: Rogue One” slated for release in December 2016. The key question is, will Star Wars be enough of a boon to support DIS and turn the stock price higher in coming weeks, months, and even years?

There is a lot more to Walt Disney Co. than Star Wars. They have made brilliant moves in recent years with their acquisition of Lucasfilm, Marvel Studios, Pixar, and The Muppets to name a few. However, there are other areas of Walt Disney Co., such as the rising sports right costs of ESPN, that weigh heavy in the minds of some Wall Street pundits. Enough so, that some are doubting the prospects of a long-term move higher for DIS shares.

DIS’s December decline, from a technical standpoint, is most likely a correction of the longer-term move up, and the breaking point is $101.3. Our price forecasting model, based on various components of technical analysis, shows that the long-term outlook for DIS is positive, but that the downward correction could extend in coming weeks before DIS overcomes key resistance at $114.5.

The following table shows the near-term targets and support levels along with probabilities of meeting those targets and levels within the next 10 trading days. This is a short-term forecast, but the implications of targets and levels discussed could have a long-term impact on the share price of DIS.

DIS-Table

On Monday, December 28, KaseX confirmed a bullish turn signal (green arrow) and a first buy signal (yellow triangle). The combination of these two signals is called a pierced dart, and is usually a strong buy. The pierced dart puts short term odds in favor of a move to at least $108.5. This then connects to $110.5 and $114.5. A close over $114.5, which is near the 62 percent retracement of the decline from $120.65 to $104.3 and the $114.75 swing high, would indicate the long-term bullish move is going to continue.

20151229 DIS

However, the wave formations down from $120.65 and $114.75 indicate a deeper test of support might take place first. This hinges on a close below $105.6, which is near the 62 percent retracement of the move up from $104.3. A close below $105.6 would shift near-term odds in favor of a deeper test of support with $103.8 and $101.3 as the next thresholds.

The reason that $101.3 is the breaking point for DIS is that it is the 62 percent retracement of the move up from $90.0 to $120.65, the 1.00 projection for the wave $120.65 – 107.62 – 114.75, and the 0.618 projection for the wave $122.08 – 90.0 – 120.65. A close below $101.3 would not only call for the decline to extend to $96.4 and $93.7, the 1.382 and 1.618 projections of the wave down from $120.65, but possibly $88.6, the 1.00 projection of the wave down from $122.08.

The confluence at $101.3 indicates that DIS shares will be hard pressed to close below this level. We do not expect $101.3 to be broken, and as long as this level holds, it means Walt Disney Co.’s “Essence of the Force Strategy” is working and there may be a good buying opportunity on a move back up from $101.3 if prices slide this low.

This is a brief technical analysis of DIS based upon Kase’s technical forecasting models and trading indicator KaseX. If you are interested in taking a trial of KaseX please contact sales@kaseco.com. We would love to get your thoughts about the forecasted targets and probabilities. Leave a comment or send them along with your request for a trial to sales@kaseco.com.

Apple Inc. (AAPL)

Apple’s stock has taken a bit of a beating this year, and the holiday season has not been the boon loyal shareholders had hoped for. Most technical factors are negative and odds favor a continued decline. However, there are a few positive technical factors that indicate the upward correction that began on November 21 could extend first.

Overall, the outlook is for AAPL is negative and our technical price forecasting model indicates that over the next ten days there is a 70 percent chance for $106.4 and a 60 percent chance for $103.8.

AAPL - Table

The decline from $123.82 is forming a five-wave trending pattern, and $102.5 is the key support target for the formation. Wave III is currently in progress and $102.5 is a potential stalling point and beginning of Wave IV. Should prices settle below $102.5 look for Wave IV to form from $98.8.

There is some technical evidence that indicates AAPL could rise to $108.9 and even $111.0 before the first target at $106.4 is met. The decline stalled at $105.57 on Monday, formed a pseudo hammer, and has been flirting with Friday’s $107.5 midpoint. In addition, KaseX, shown in the chart below, confirmed a weak bullish turn threat (gray arrow). The signal indicates stops on the daily chart could be tightened to approximately $112.3, which is in line with our $112.6 resistance threshold.

AAPL

If the upward correction is going to extend in a significant manner it will need to close over at least $108.9 and very likely $111.0. The latter is strong near-term resistance that we expect to hold. A close over $111.0 would open the way for and extended upward correction to $112.6 and even $114.4.

Under Armour Inc (UA)

Since September UA’s stock performance has been dismal relative to that of their largest competitor, Nike (NKE), whose earnings hit the street Tuesday afternoon. NKE is pegged as one of the strongest performing stocks in the Dow Jones Industrial average, up 35 percent so far. The outlook for NKE, at least from a technical standpoint, is bullish. Conversely, we expect UA’s share price to continue to decline.

Most technical factors for UA are negative and odds are 75 percent for at least $78.1. This then connects to key support at $76.1. Longer-term odds favor $72.5 and $70.5, but we expect a correction to take place before the lower targets are met.

UA - Table

Kase StatWare, shown in the chart below, reflects the bearish sentiment with first class short KEES permissions (pink dots) on the daily bars for the past few days. That said, momentum on the KaseCD and KasePO are setup for divergence and the KasePO is nearing oversold territory. This means that a correction might take place soon.

UA

The one solid positive technical factor was November 22’s hammer. This is a reversal pattern that also indicates a correction might take place before UA falls below $78.1 again. The correction should hold $81.9, but $84.6 is the key threshold. A close over this would open the way for an extended upward correction before the decline ultimately continues.

These are brief technical analyses based upon Kase’s technical forecasting models and trading indicators KaseX and Kase StatWare. If you are interested in taking a trial of KaseX or Kase StatWare please contact sales@kaseco.com. We would love to get your thoughts about the forecasted targets and probabilities. Leave a comment or send them along with your request for a trial to sales@kaseco.com.

targetBy Dean Rogers

It has been a wild week on Wall Street and for markets around the world. Global equities have ridden a roller coaster in the U.S., Asia, and Europe, the U.S. Dollar strengthened a bit after a tumultuous decline, and oil is trying to find its bottom after a significant rally to $42.86 from our weekly commentary’s $37.9 target.

U.S. 10 Year Treasury bonds have come along for the ride and have fallen to 127’18 so far after stalling at 129’28. The 129’28 high was just above our June 30, 2015 projected resistance of 129’16.5. At this point, as shown in the chart below, bearish momentum divergences formed when rising price highs were accompanied by falling momentum highs on the KaseCD, MACD, and slow stochastic.

TY daily

The divergences show that the decline will likely extend. However, there are several positive technical factors that indicate an upward correction should take place first.

The daily candlestick chart above shows a morning star setup that formed on August 27. The confirmation point (open of August 26) is 128’18. This resistance level is also in line with the 38 percent retracement of the decline form 129’28 as shown in the chart below. Should the decline extend as expected over the next few days, 128’18 must hold. A close over this would call for 128’31.5, the 62 percent retracement.

TY weekly

The wave formation down from 129’28, shown in green below, met the 0.618 projection at 127’18. Most waves (our studies show around 77 percent) that meet the 0.618 projection extend to at least the 1.00 projection, in this case 126’27. Therefore, odds favor at least 126’27. This is in line with the 62 percent retracement of the move up from 124’29 as shown in the daily chart (in blue). A close below 126’27 would call for 126’08 and 125’26.

In summary, for the near-term, these technical factors indicate U.S. 10 year treasuries should decline to at least 126’27, but that a small correction to 128’18 might take place first. The longer-term targets are discussed in our original article published June 30, 2015.

By Dean Rogers

Technical analysis provides traders and market analysts with extremely valuable tools that can help determine future support and resistance and major turning points. A good example of this came from our recent article Ask Kase: How to Trade the Shanghai Index that was published on June 9, 2015 by Cynthia A. Kase, CMT, MFTA. Ms. Kase’s analysis lead her to call for an overdue downward correction of the Shanghai Composite Index (SSE) once resistance at 5200 was met within a +/- 50 point tolerance. SSE rose to 5178.19 on June 12, before turning lower and eventually transitioning into the bearish collapse that has transpired over the past several weeks.

The market has blown through Ms. Kase’s lowest support level of 4550, below which she stated, “a much more sustained decline would commence”. She hit the nail on the head, and now, the techncials are showing us that SSE is poised for at least 2300 after a potential upward correction from 2947.94.

The decline from 5178.19 forms a very clear nested wave formation that has two primary waves: 5178.19 – 3373.54 – 4184.45 (blue) and 4184.45 – 3537.36 – 4006.34 (green). Both waves project to 2300 +/- 80 points. This is a very important target and potential bottom for SSE because it is the 1.00 projection for the wave down from 5178.19 (blue) and the 2.764 projection for the wave down from 4184.45 (green).

shanghai composite index waves

A sustained close below 2300 would call for a much more severe collapse to 2034, 1710, and possibly 1275.

As stated though, an upward correction might take place from 2947.94 before the decline continues. This is because both of the waves down from 5178.19 and 4184.45 met crucial projections around 3000. The 3000 level was also in line with the 62 percent retracement of the move up from the October 2008 swing low of 1664.93 to 5178.19.

To say the least, 3000 is important support, so a small correction to 3350, the 38 percent retracement of the decline form 4006.34 would be normal.

Retracements to 2947.94

shanghai composite index retracements

Key resistance for the near term is 3585, the 62 percent retracement from 4006.34 and the 50 percent retracement from 4184.45. A close over 3585 would open the way for 3755, the 62 percent retracement from 4184.45 and the 38 percent retracement from 5178.19. This is the level that must hold for the outlook to remain negative for at least the next few weeks.

A daily morning star setup (not shown) confirms that the upward correction might take place within the next few days. However, most momentum indicators show that a pullback will be nothing more than a temporary correction.

The weekly stochastic moved below 20 and is oversold, but it can remain there for weeks (or even months) before the index reverses significantly higher. All other momentum indicators, including the KaseCD and KasePO show declining momentum, which does not bode well for the formation of a bottom soon.

shanghai composite index weekly momentum

In summary, most technical factors are negative and odds favor a decline to at least 2300. A pullback from 2947.94 might take place first, but weekly and daily momentum indicators show that such a move will likely be corrective and should hold resistance at 3350 and no higher than 3585. Therefore, for now, buckle in for the rest of the ride lower.

Learn more about Kase’s trading indicators such as the KasePO and KaseCD, weekly crude oil and natural gas forecasts, and other services, at www.kaseco.com.