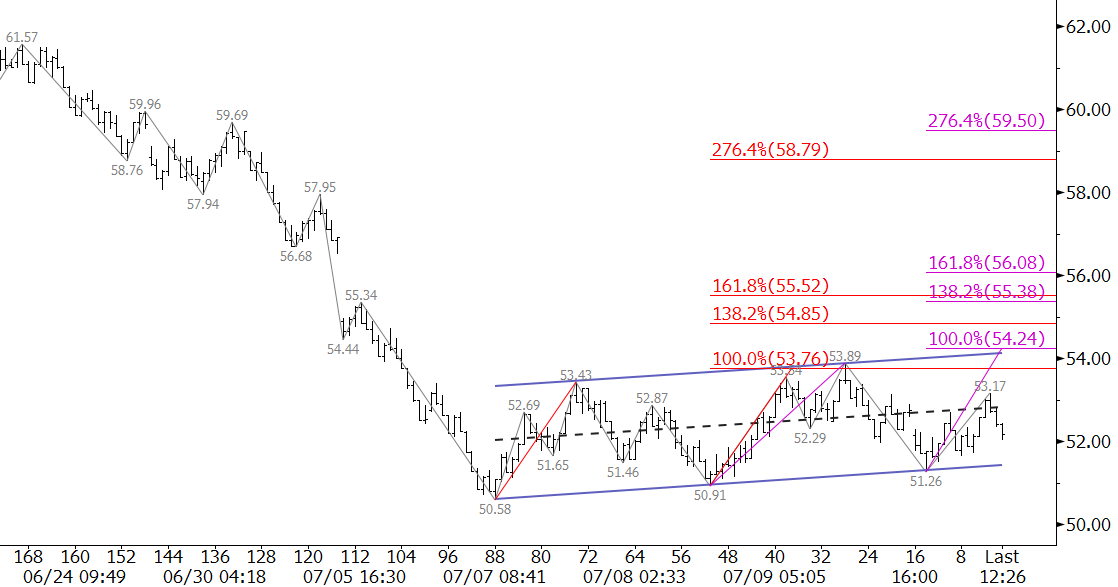
Perfect geometric formations are a rare commodity. They are useful gems of information that can tell us a lot about a market’s outlook and general direction. It is important to pay attention to the implications of a successful break out of the pattern, and it is even more important to watch for patterns that fail.
WTI’s bearish flag on the $0.50 Kase Bar chart is as close to a textbook example as one will ever see. Flags are extremely reliable continuation patterns. Because this flag formed after a decline, and is sloping upwards, it is a bearish pattern that indicates the move up is corrective and that the decline should continue.

The waves within the flag have fulfilled the 1.00 projection for the wave $50.58 – 53.43 – 50.91. This is significant because it is evidence that the move up is unfolding as a three-wave ABC pattern, which is more evidence that the move is corrective.
Prices settled in the lower half of the formation on Monday, which does not bode well for another test of the upper trend line. A close below $51.8, which is near the bottom trend line, would indicate the move down is going to extend to at least $49.9. Our detailed weekly analysis discusses the connections to targets in the mid- to low-$40s upon a break lower.
There is an outside chance that the formation will fail, but prices will need to close over $54.8 to prove that an extended upward correction and potential recovery is underway. Technically, the flag will fail upon a close over the upper trend line, which is currently $54.2. However, for many technical reasons, $54.8 is the threshold for a positive near-term outlook. Most importantly, it is near the 38 percent retracement of the decline from $62.22 and the midpoint of July 6th.
For now, watch the flag formation closely. Odds favor a break lower and close below $51.8. The directional breakout of this pattern will be a strong clue as to the direction of WTI for the next several weeks.
This is a brief analysis and outlook for the near-term. Our weekly Crude Oil Commentary is a much more detailed and thorough energy price forecast. If you are interested, please sign up for a complimentary four week trial.

