WTI Crude Oil Technical Analysis and Short-Term Forecast
This is a brief analysis for the next day or so. Our weekly Crude Oil Forecast and daily updates are much more detailed and thorough energy price forecasts that cover WTI, Brent, RBOB Gasoline, Diesel, and spreads. If you are interested in learning more, please sign up for a complimentary four-week trial.
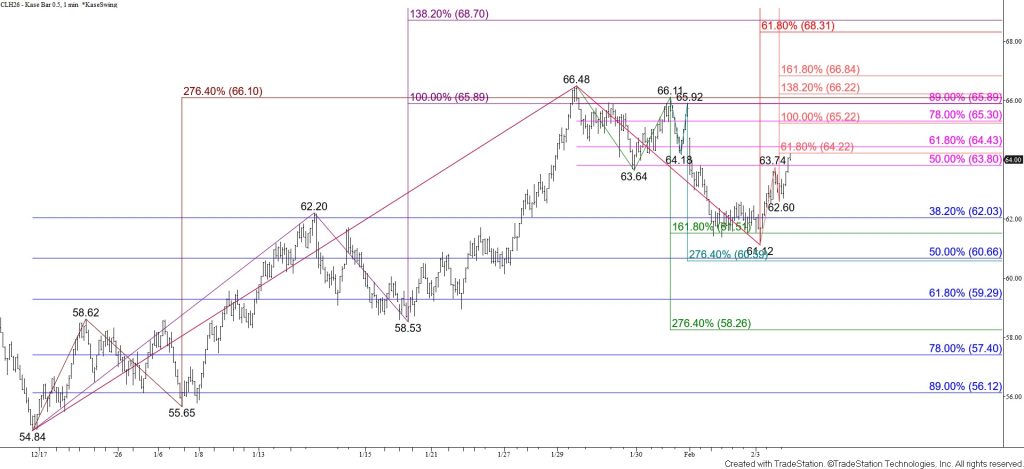
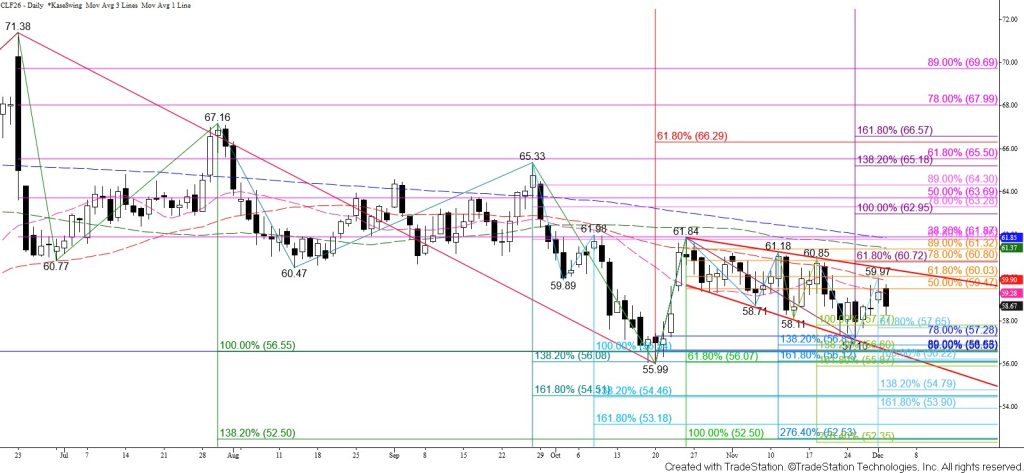
March WTI crude oil initially fell to challenge the 38 percent retracement of the rise from $54.84 at $62.0 and the $61.5 larger than (1.618) target of the wave down from $66.48 again. Both levels held on a closing basis for the second straight day, and the rise from $61.12 is poised to reach its $64.3 smaller than (0.618) target. This is also the 62 percent retracement of the decline from $66.48. Settling above $64.3 will imply that the corrective pullback from $66.48 is complete and call for a push to challenge the $65.2 equal to (1.00) target of this wave and the 78 percent retracement. Rising to $65.2 will also fill Monday’s breakaway gap down from $65.21. Settling above $65.2 will call for another test of $66.1, an important target that held on a closing basis last week. Settling above $66.1 will clear the way for $66.9 and higher, putting March WTI back on a path to eventually challenge the $69.8 confirmation point of a double bottom that formed between the $54.56 and $54.84 swing lows.
Monday’s midpoint held on a closing basis, and the daily bearish KaseCD divergence and Stochastic overbought signals that were confirmed within the past few days warn that a deeper test of support might still occur. Taking out the $62.6 corrective swing low of the wave up from $61.12 will invalidate this wave and the connection it makes from $64.2 to $65.2 and higher. This will also call for another test of $62.0 and possibly key near-term support at $61.5. Settling below $61.5 will put the near-term odds in favor of March WTI falling to challenge $60.6 and lower.