WTI Crude Oil Technical Analysis and Short-Term Forecast
This is a brief analysis for the next day or so. Our weekly Crude Oil Forecast and daily updates are much more detailed and thorough energy price forecasts that cover WTI, Brent, RBOB Gasoline, Diesel, and spreads. If you are interested in learning more, please sign up for a complimentary four-week trial.
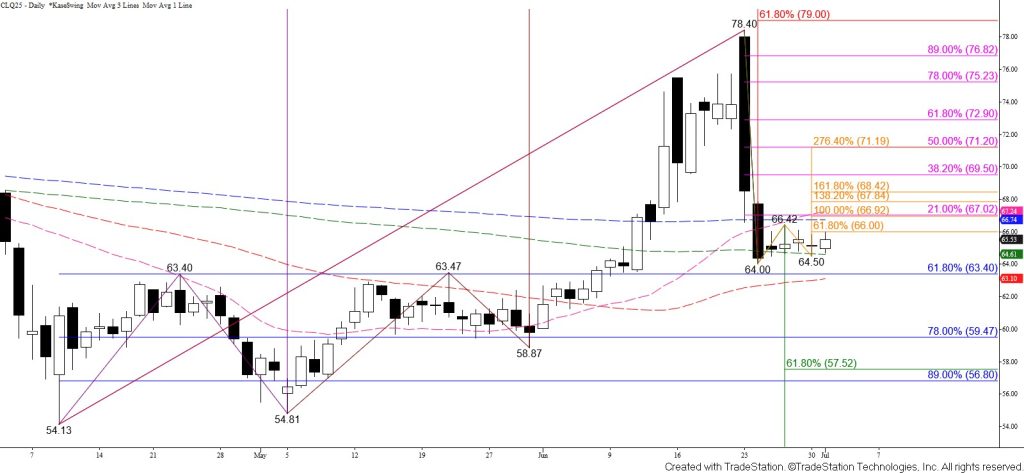
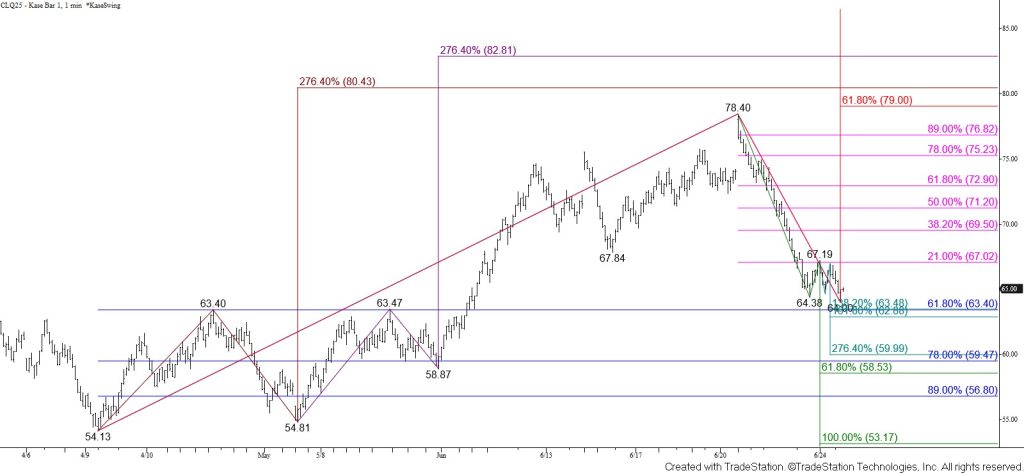
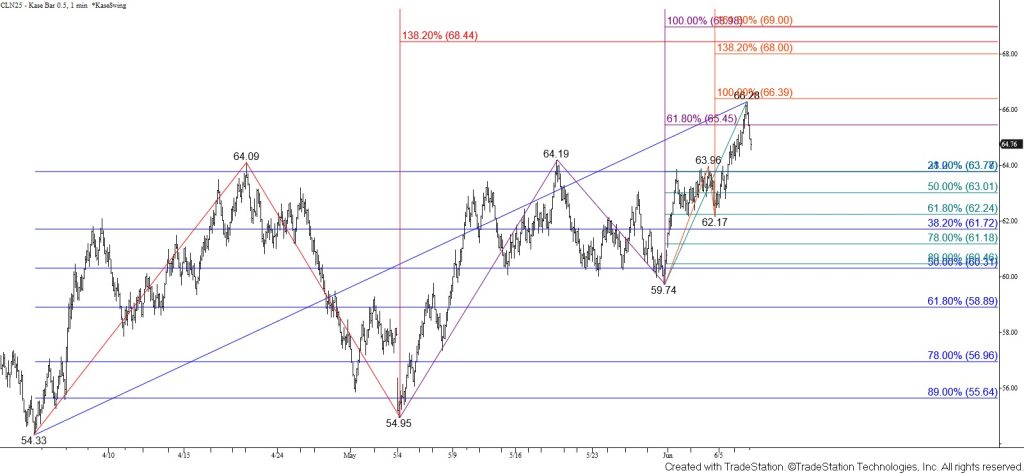
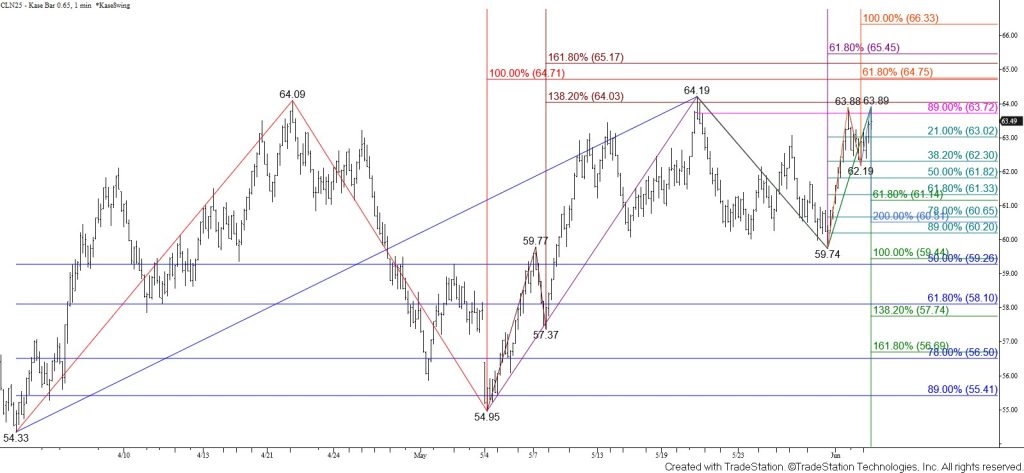
August WTI crude oil held above the 100-day moving average and rose to test the $66.0 smaller than (0.618) target of the wave up from $64.0. The $66.0 level held. However, prices now have a slightly better chance of rising to challenge this wave’s $66.9 equal to (1.00) target versus falling to challenge the 62 percent retracement of the rise from $54.13 at $63.4. Closing above $66.9 will open the way for a test of the $67.7 intermediate (1.382) target, which, more importantly, is in line with the confirmation point of daily bullish candlesticks that formed last week and on Monday. Upon a close above $67.7, look for a larger test of resistance with targets at $68.5 and then $69.5. A normal correction of the decline from $78.40 will hold $69.5.
Nevertheless, this is still a tight call for the next few days because $66.0 and the midpoint of last Tuesday have held. Taking out the $64.5 swing low will invalidate the wave up from $64.0 and call for another attempt to test major support at $63.4. The $63.4 level is key because it is the 62 percent retracement of the rise from $54.13 and the top of the range that the August contract had traded in between early April and late May.