Brent Crude Oil Technical Analysis and Short-Term Forecast
This is a brief analysis for the next day or so. Our weekly Crude Oil Forecast and daily updates are much more detailed and thorough energy price forecasts that cover WTI, Brent, RBOB Gasoline, Diesel, and spreads. If you are interested in learning more, please sign up for a complimentary four-week trial.
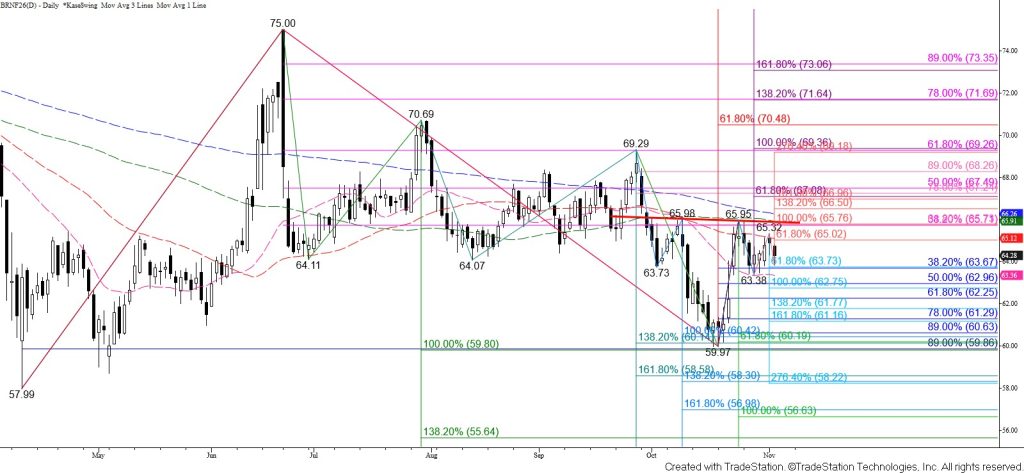
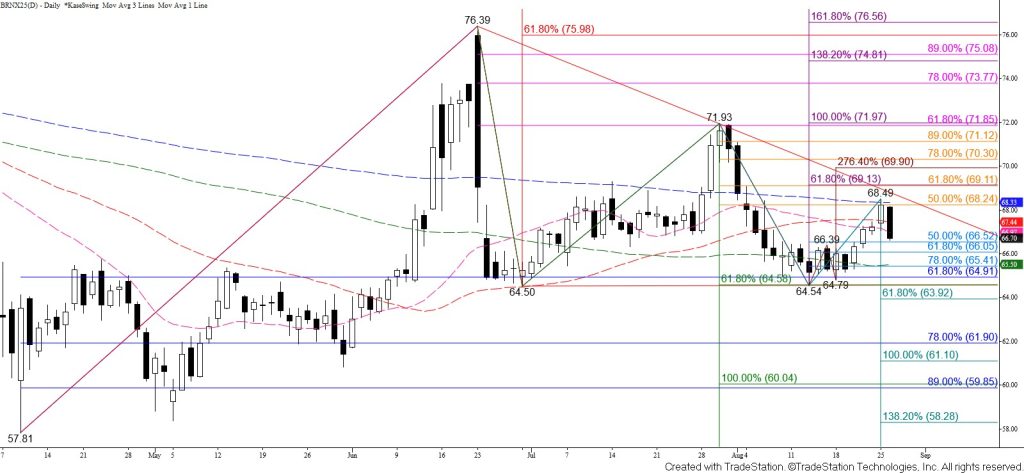
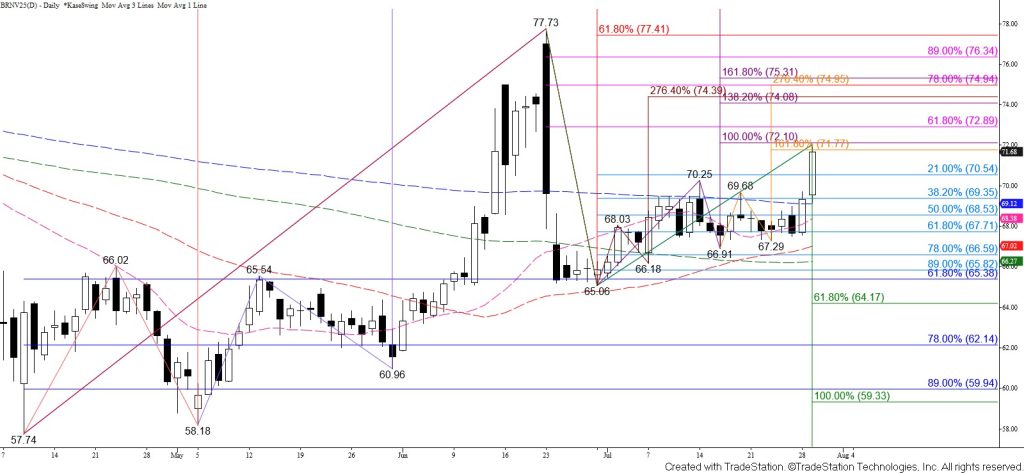
Brent crude oil continues to trade in a range that could prove to be a correction of the rise from $59.97. However, today’s decline has put the near-term odds in favor of Brent testing $63.7 again. This is a key objective for the near-term because it is the smaller than (0.618) target of the wave down from $65.95 and the 38 percent retracement of the rise from $59.97. Settling below $63.7 will call for another test of the 20-day moving average at $63.4 and likely a decline to fulfill the $62.9 equal to (1.00) target of the wave down from $65.95.
Nevertheless, $63.7 has been resilient support for the past week. Moreover, the $63.38 swing low may form the right shoulder of an inverse head and shoulders pattern with a neckline around $66.0. Should Brent continue to hold $63.7 and overcome the $65.0 smaller than target of the wave up from $63.38, look for another test of key near-term resistance at $65.8. Settling above $65.8 will put the odds back in favor of a continued rise above the neckline to challenge $66.5 and likely the $67.0 smaller than (0.618) target of the wave up from $59.97.