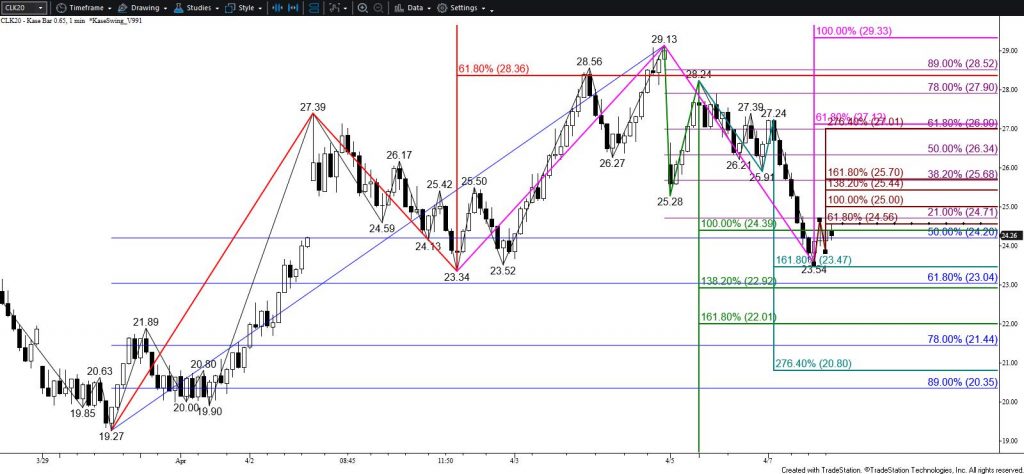
WTI Crude Oil Price Forecast
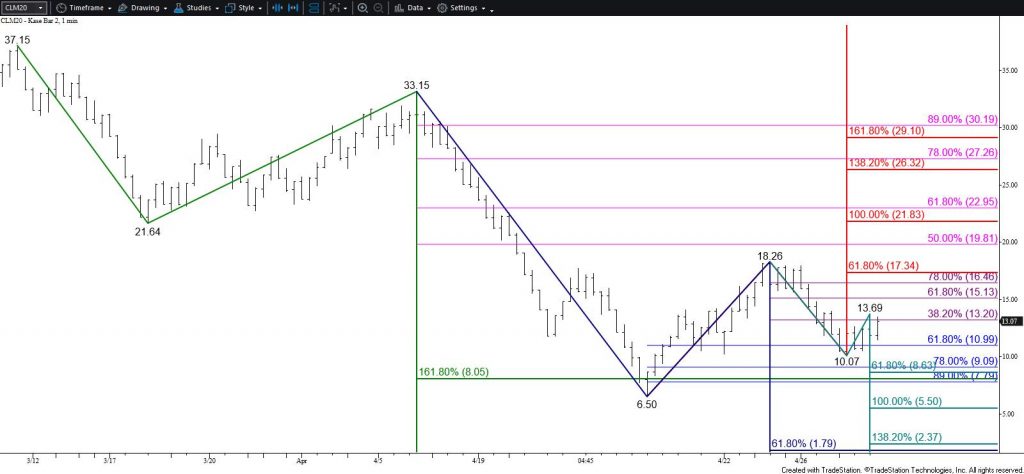
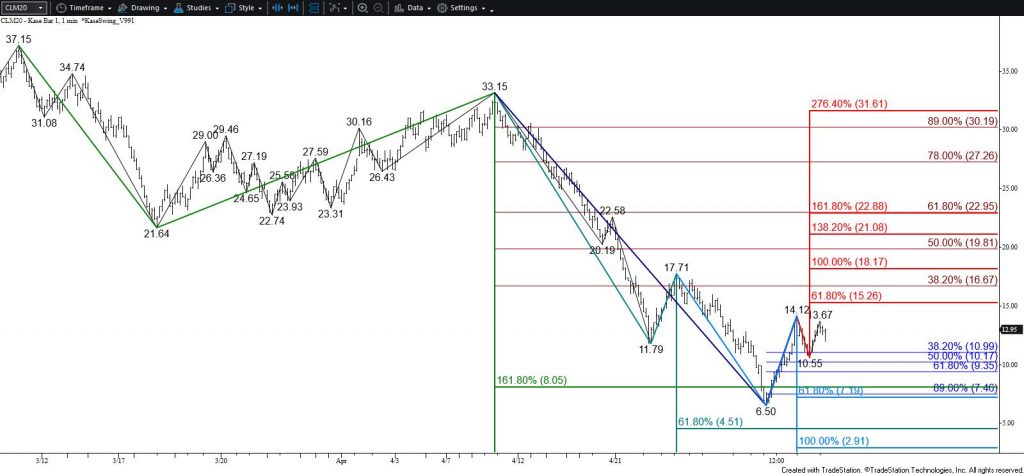
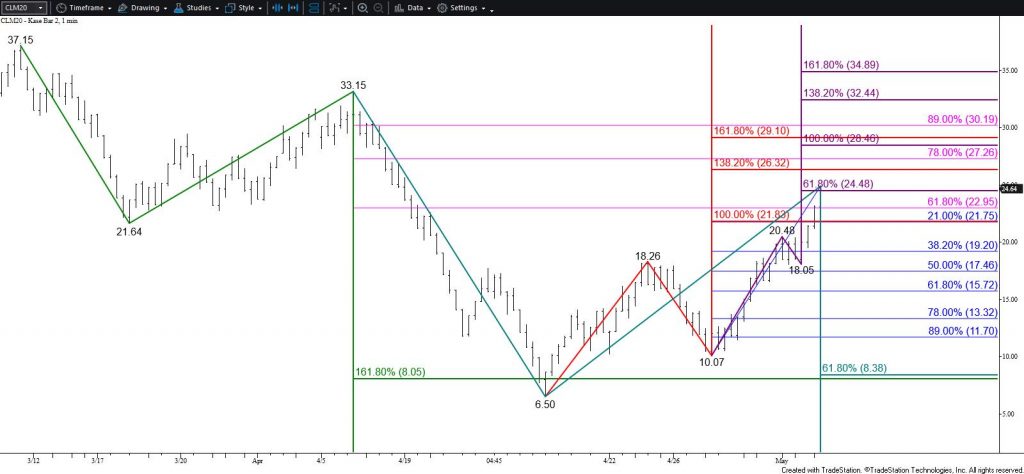
WTI crude oil has adopted a firm bullish outlook for the near-term. Today’s close above $21.8, the equal to (1.00) target of the primary wave up from $6.50), and $24.5, the smaller than (0.618) target of the sub-wave up from $10.07, opens the way for $26.5 and possibly $29.3 during the next few days. Because $29.3 is the larger than (1.618) target of the wave up from $6.50 it is doubtful that WTI will overcome this objective without a major test of support first.
WTI is looking healthy. However, for the move up to continue, or for prices to at least stabilize in the coming weeks, it will be crucial for support around the 38 percent retracement of the move up from $6.50 to hold firm. Breaking the 38 percent retracement would be a significant clue that the market is not ready to sustain higher prices and that fear still has a firm grip on oil traders.
For now, support at $23.0 will most likely hold as prices rise toward $26.5. This was the 62 percent retracement of the decline from $33.15 and is near today’s midpoint. Falling below this would call for $21.7 and possibly $19.2. The latter of these is most important because a close below $19.2 would imply that the move down is more than a simple profit-taking correction.
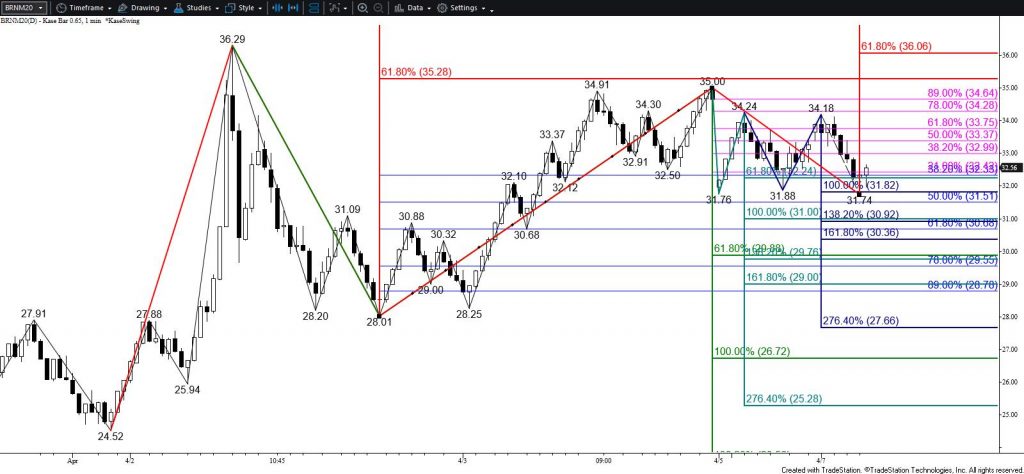
Brent Crude Oil Price Forecast
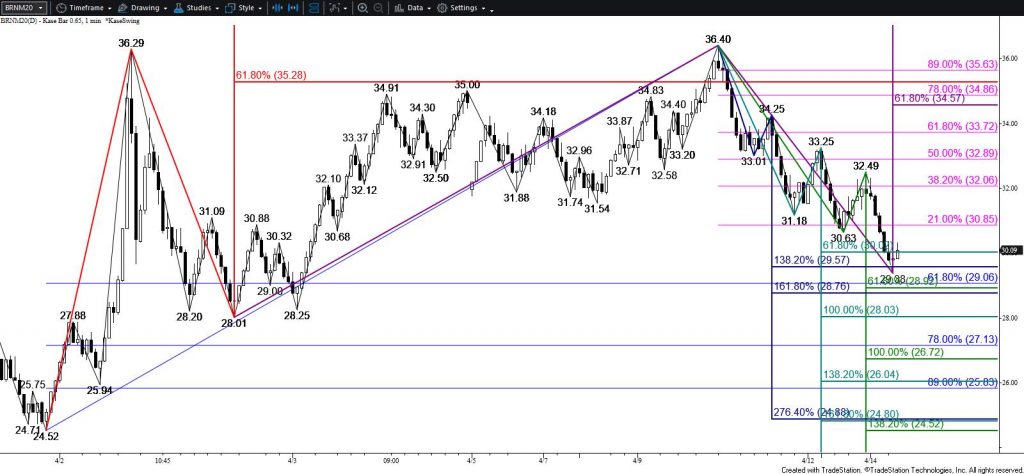
The outlook for Brent crude oil is firmly bullish for the near-term. The wave formation up from $19.99 overcame its intermediate (1.382) target today and is poised to reach the $33.4 larger than (1.618) target. This is a potential stalling point. However, any move down will most likely prove to be corrective and is expected to hold $28.6. Ultimately, closing above $33.4 will clear the way for $34.4 and higher.
As stated, $28.6 is expected to hold, but key support and the barrier for a bearish near-term outlook is $26.9.
This is a brief analysis for the next day or so. Our weekly Crude Oil Forecast and daily updates are much more detailed and thorough energy price forecasts that cover WTI, Brent, RBOB Gasoline, Diesel, and spreads. If you are interested in learning more, please sign up for a complimentary four-week trial.