Natural Gas Price Forecast
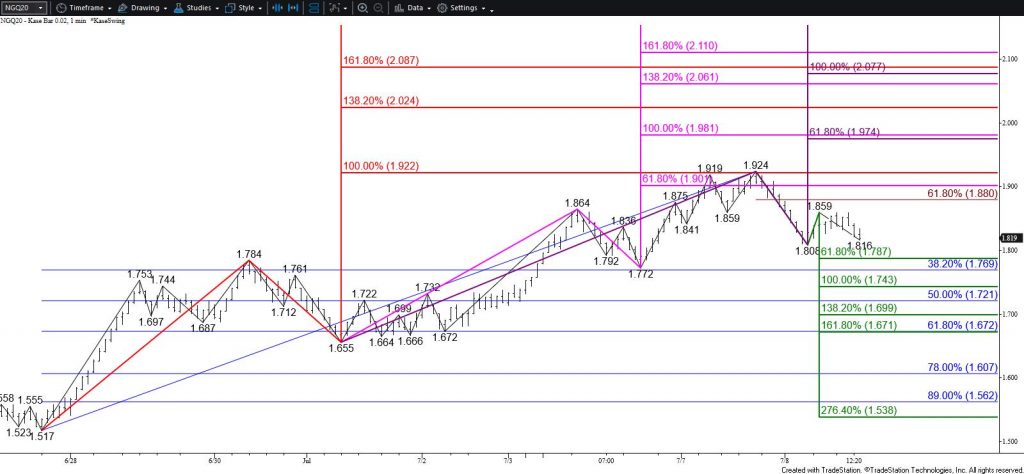
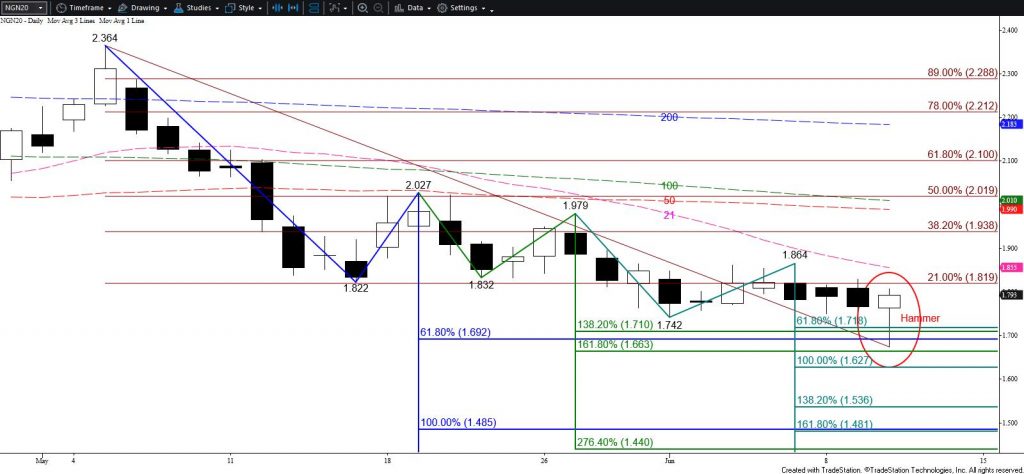
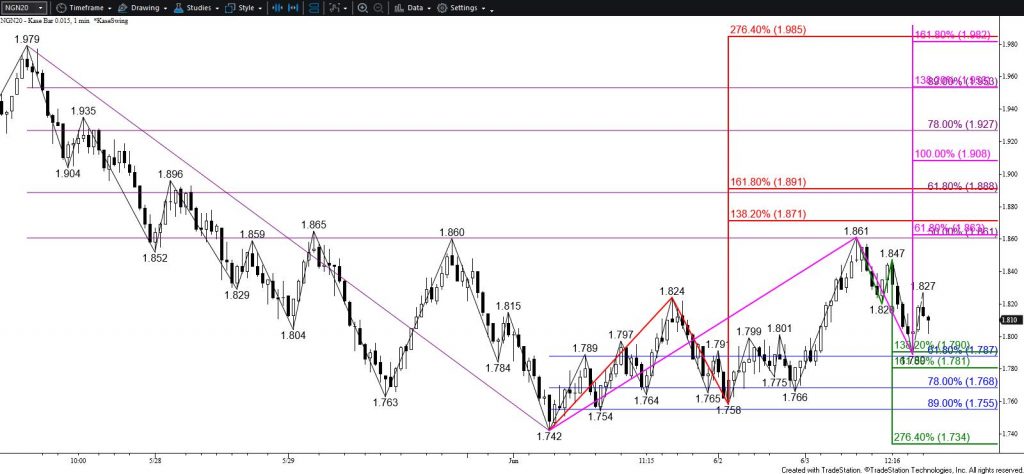
Natural gas could not break support at $1.70 and make the push for $1.66 during the last few days. Support at $1.70 is the larger than (1.618) target of the first wave down from $1.924 (dark cyan) and is marginally below the 50 percent retracement of the rise from $1.517 (blue). The subsequent wave up from $1.708 (orange) accelerated this afternoon and is testing its equal to (1.00) target and the 38 percent retracement of the decline from $1.924 (dark red). This is positive for the near-term outlook.
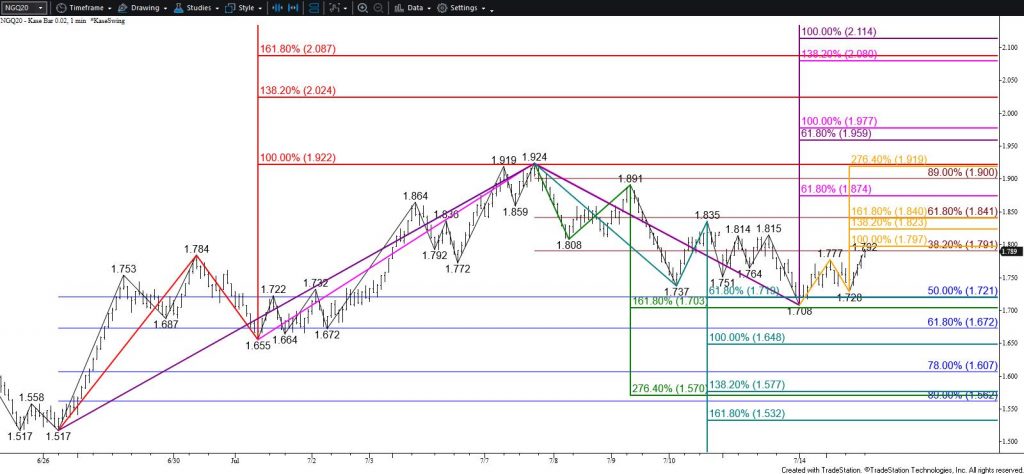
Because $1.70 held and based on this afternoon’s move up, near-term odds have shifted in favor of challenging at least $1.84 tomorrow. This is the larger than target of the wave up from $1.708 (orange) and the 62 percent retracement of the decline from $1.924 (dark red). Settling above this will call for $1.91, which then connects to $1.96 and higher.
Nevertheless, while $1.84 holds, there is a modest chance for the move down to extend to $1.66. Falling below the $1.728 swing low will increase odds for $1.66 because this would invalidate the wave up from $1.708 (orange) that makes the connection to $1.84 and $1.91. Support at $1.66 is key for the near-term outlook and is expected to hold. Closing below this would call for another test of $1.59 and possibly lower.
This is a brief analysis for the next day or so. Our weekly Natural Gas Commentary and daily updates are much more detailed and thorough energy price forecasts that cover key natural gas futures contracts, calendar spreads, the UNG ETF, and several electricity contracts. If you are interested in learning more, please sign up for a complimentary four-week trial.