Gold Technical Analysis and Near-Term Outlook
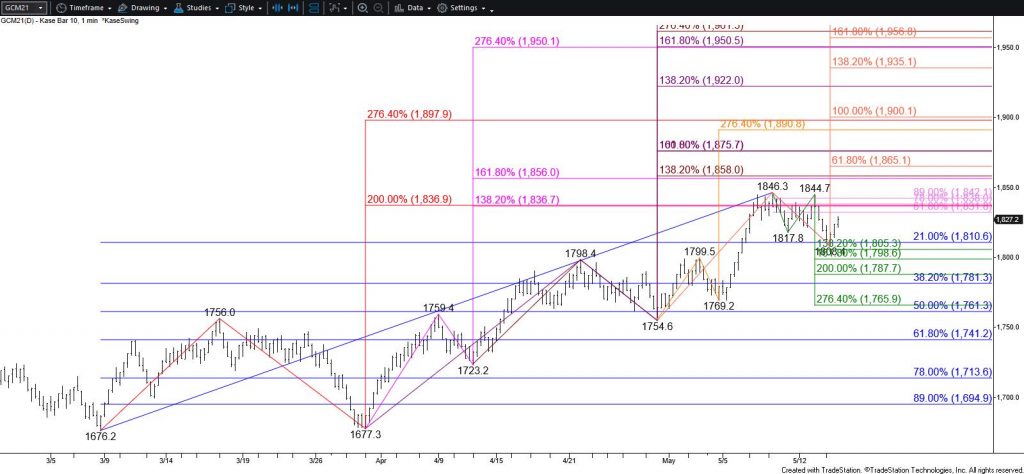
Gold has sustained a close above the 200-day moving average for the past four days. This is bullish for the outlook and suggests the market has adopted longer-term bullish sentiment. The challenge for the near-term is that bearish daily candlestick patterns and momentum signals indicate a test of support might take place before rising to challenge the next major objective at $1897.
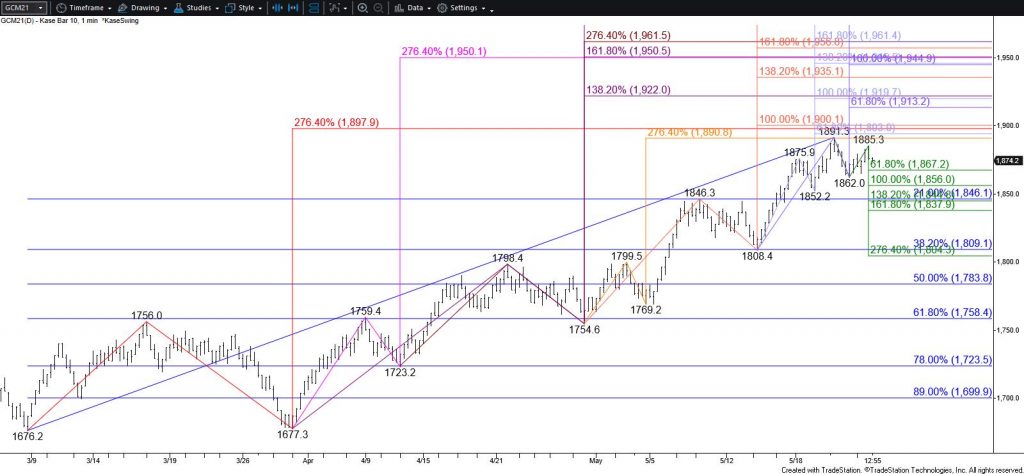
Nevertheless, a move above $1885.3 early tomorrow will negate some of the downside risk by invalidating the intra-day wave down from $1891.3. Based on the wave structure, a move above $1885 should clear the way for $1897, a close above which will clear the way for $1910 and higher.
With that said, should gold take out the $1867 smaller than (0.618) target of the wave down from $1891.3 first, look for a test of at least $1856 and possibly $1846 during the next few days. Closing below $1856 will confirm the bearish candlestick patterns and settling below $1846 will confirm them. For now, $1846 is expected to hold, but settling below this will call for a deeper correction before the move up continues.
This is a brief analysis for the next day or so. Our weekly Metals Commentary and daily updates are much more detailed and thorough energy price forecasts that cover key COMEX precious metals futures contracts and LME Non-Ferrous (Base) metals, spot gold, the gold/silver ratio, and gold ETFs. If you are interested in learning more, please sign up for a complimentary four-week trial.