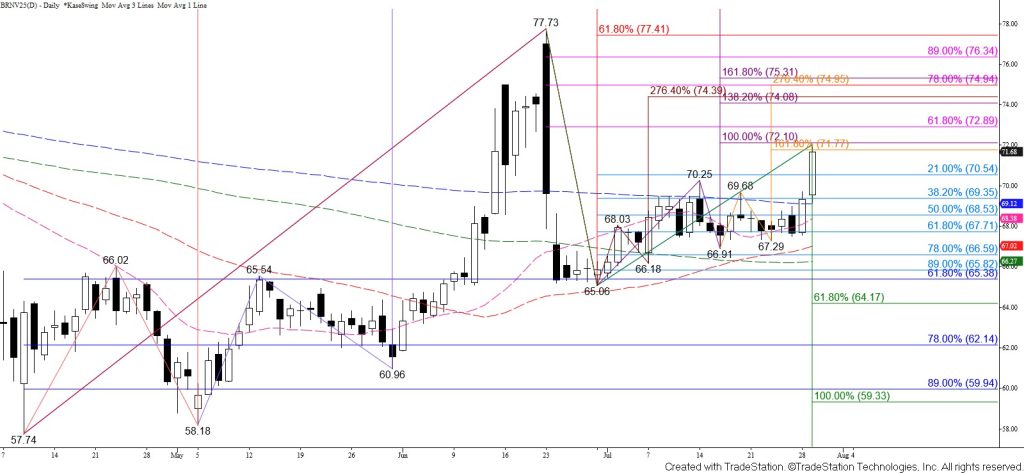
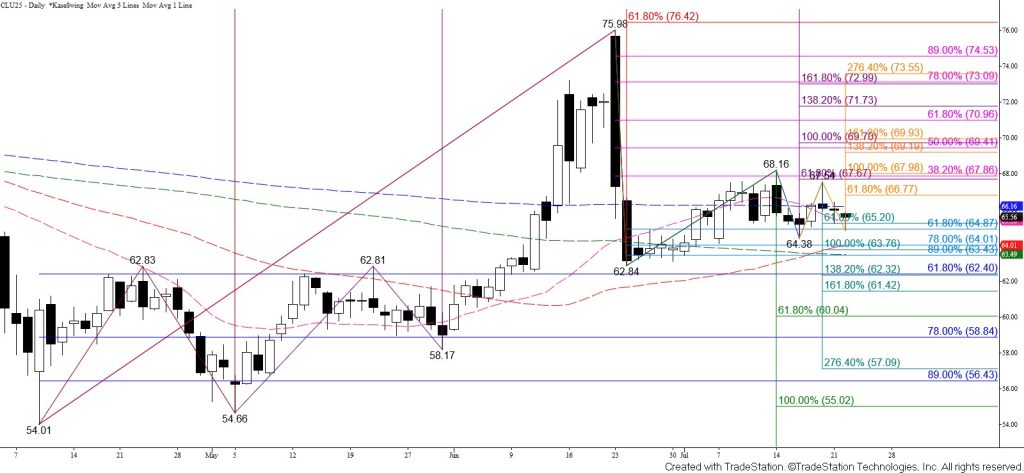
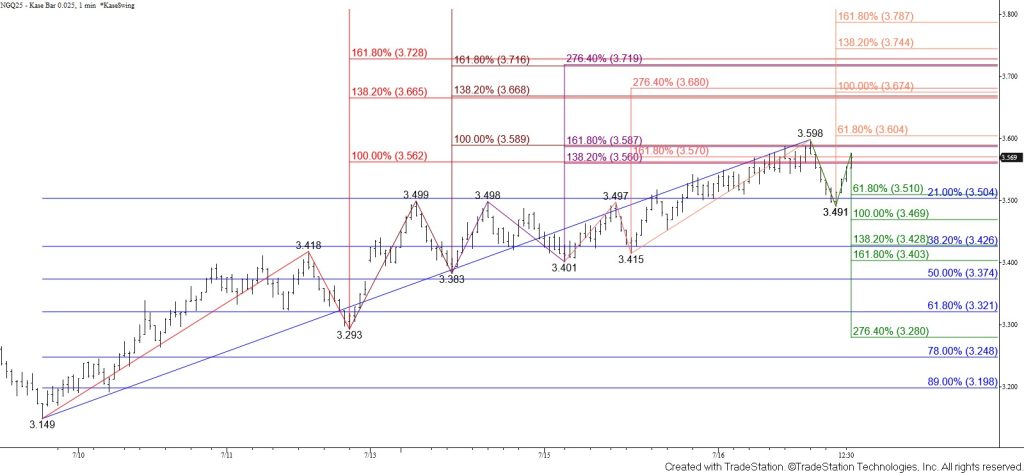
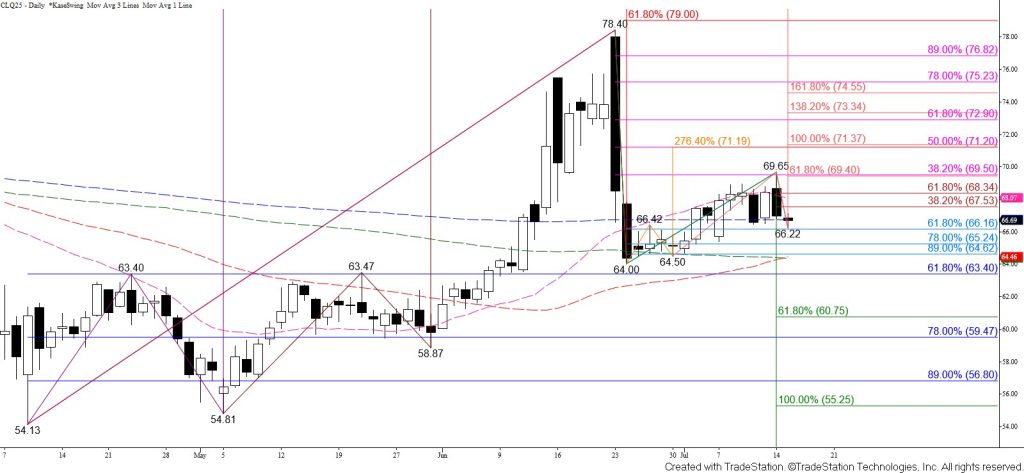
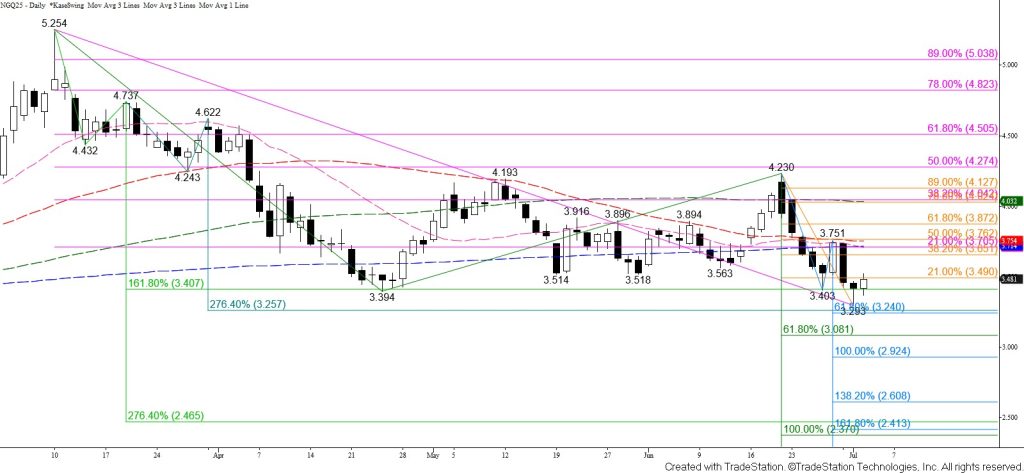
Natural Gas Technical Analysis and Near-Term Outlook
This is a brief analysis for the next day or so. Our weekly Natural Gas Commentary and daily updates are much more detailed and thorough energy price forecasts that cover key natural gas futures contracts, calendar spreads, the UNG ETF, and several electricity contracts. If you are interested in learning more, please sign up for a complimentary four-week trial.
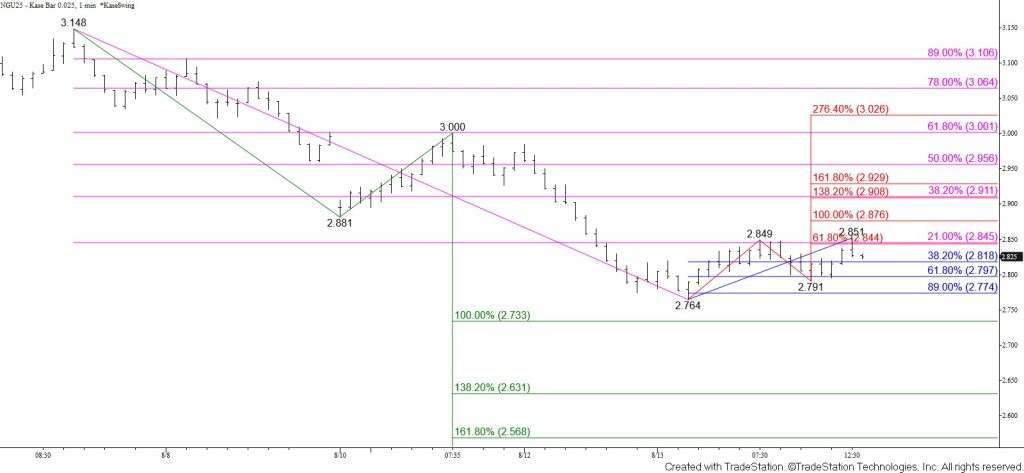
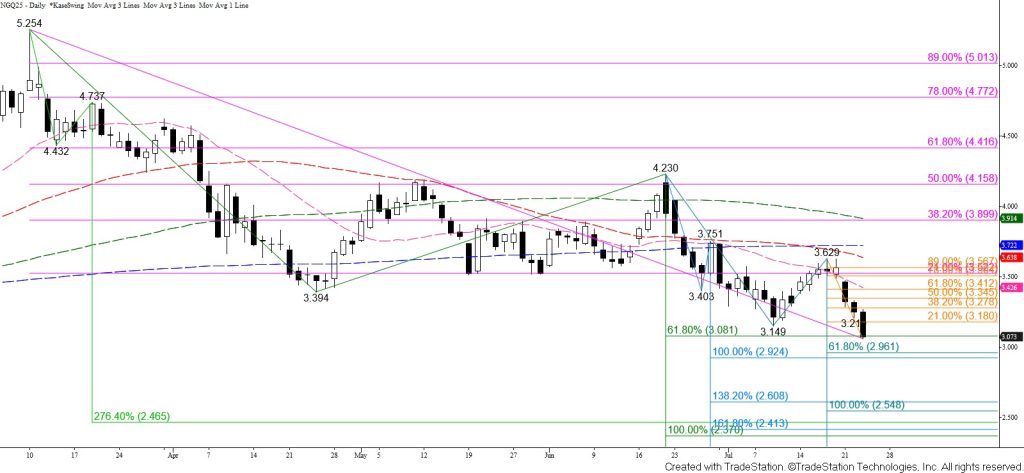
Natural gas retains a firm bearish outlook and is poised to reach targets at $2.73, $2.68, and $2.64 in the coming days. These are confluent projections of the waves down from $4.198, $3.657, and most recently, $3.148. The wave down from $3.148 projects to $2.73 as the equal to (1.00) target and connects to $2.64 as the intermediate (1.382) target. The $2.64 objective is a probable stalling point because this is also the equal to target of the largest wave down from $4.198. However, any move up will likely be a correction because the primary wave down from $5.21 calls for an eventual test of its $2.38 equal to target. This is also the equal to target of the wave down from $3.657 that projects to $2.68 as the smaller than (0.618) target.
That said, today’s morning star setup and the wave up from $2.764 warn that a correction might occur first. The wave up from $2.764 fulfilled its $2.84 smaller than target and projects to $2.88 as the equal to target. Therefore, there is a good chance for a test of at least $2.88 first. However, should prices take out the $2.791 swing low, this wave will be invalidated, opening the way for $2.73 and lower.
Nevertheless, overcoming $2.88 would call for the $2.91 completion point of the morning star to be challenged. A simple correction will likely hold $2.91 because this is also the intermediate target of the wave up from $2.764 and the 38 percent retracement from $3.148. Key resistance for the near-term outlook is $2.99. This is the confirmation point of the morning star reversal pattern and the 62 percent retracement from $3.148. Settling above $2.99 is currently doubtful but would reflect a bullish shift in near-term sentiment.