Technical analysis is technical. This means there are mathematics, charts, and statistics involved. Some interested in studying and using technical analysis are dismayed when they encounter numbers and charts. A math, engineering, science, or financial degree is not required to make use of technical analysis. However, an orientation towards structuring a view of reality mathematically is helpful.
Some people think technical analysis is a way to quickly make a lot of money, become a hotshot trader, or a means to finding the “Holy Grail” of trading systems. Technical analysis is certainly a means to success, but there is no way to get around the need for commitment and perseverance. Success in using technical analysis, like any endeavor, will take hard work, commitment, and perseverance.
The Four Aspects of Technical Analysis
When using technical analysis there are four basic applications: instrument selection, timing trade entries and exits, managing risk, and forecasting.
Technical analysis can be used to select instruments to trade. For instance, if a trader wanted to scan the 1,000 most active stocks and pick the instrument most likely to take a sharp turn, they could use technical momentum indicators such as the MACD or RSI to look for divergence. Divergence is a momentum signal that is triggered when a trend is exhausted. If a divergence occurs, it is likely that the instrument is getting ready to turn in a statistically significant manner. The trader can then decide to further analyze and possibly trade that instrument.
Once a trader has selected an instrument they can use technical analysis to determine the instrument’s direction, strength and extent of potential trends, support and resistance levels, potential turning points, and risk.
Technical analysis is, as the name implies, a study or examination of the market. The analogy commonly used in technical forecasting is that it is similar to cartography or map drawing. In other words, you are drawing a map of how to get from point A to point B.
Once the map has been drawn and the forecast is complete a trader can use technical indicators, geometric formations, and other methods of analysis to determine entry and exit point for the market. This is called market timing, and is one of the greatest strengths of technical analysis.
Example of Using Technical Analysis
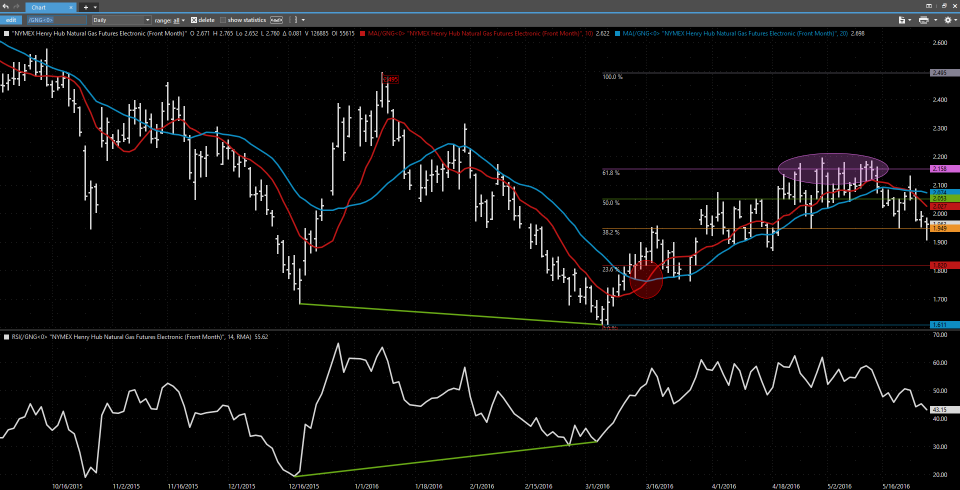
In the daily chart below as natural gas prices fell to new price swing lows the RSI momentum indicator was making higher lows. This was a clue that the decline was exhausted and that a significant turn higher was about to take place. A trader with a short position would possibly cover the positon once the divergence was confirmed (green trend lines).

After covering the short trade, the trader could then time a long entry when the 10-period moving average (red line) crossed above the 20-period moving average (blue line). This crossover is shown within the red circle. When the fast moving average (10-period) rises above the slow moving average (20-period) it suggests the move up should continue because there has been an upward shift in momentum.
Once the long trade has been taken, the trader can then begin to identify resistance levels using other methods of technical analysis. In the example above, a series of Fibonacci retracements from the $2.495 swing high to the $1.611 swing low are shown to the right of the chart. The 38.2, 50, and 61.8 percent retracement levels of this move were identified as resistance well ahead of being met. Note that at each of these levels a small turn lower or trading range took place. Ultimately, the move up held near the 61.8 percent retracement (pink ellipse) and turned lower again.
Conclusion
Technical analysis is a means of analyzing and interpreting what the market knows about itself. As discussed, the tools within the practice of technical analysis are useful for instrument selection, timing trade entries and exits, managing risk, and forecasting. By learning and using technical analysis, one can become a better trader by gaining a deeper level of insight into the markets they trade.


Thanks for saying that technical analysis is analyzing what the market know about itself. If I was going to get a technical analysis done I would want to make sure that it was done professionally. I’ll need to find someone that I trust to help me if I decide that it is right for me.