
Outlook for WTI
March WTI crude oil’s formation of a second daily star (in this case a hammer), confirmed daily KCDpeak, oversold Stochastic, and failure to break the $58.07 swing low are all factors that indicate the upward correction from $58.07 still has a reasonable chance of extending before the decline continues. However, unless WTI settles above at least $59.8 and more likely $60.4 to confirm the morning star setup (made up of the aforementioned stars) odds will continue to favor a decline.
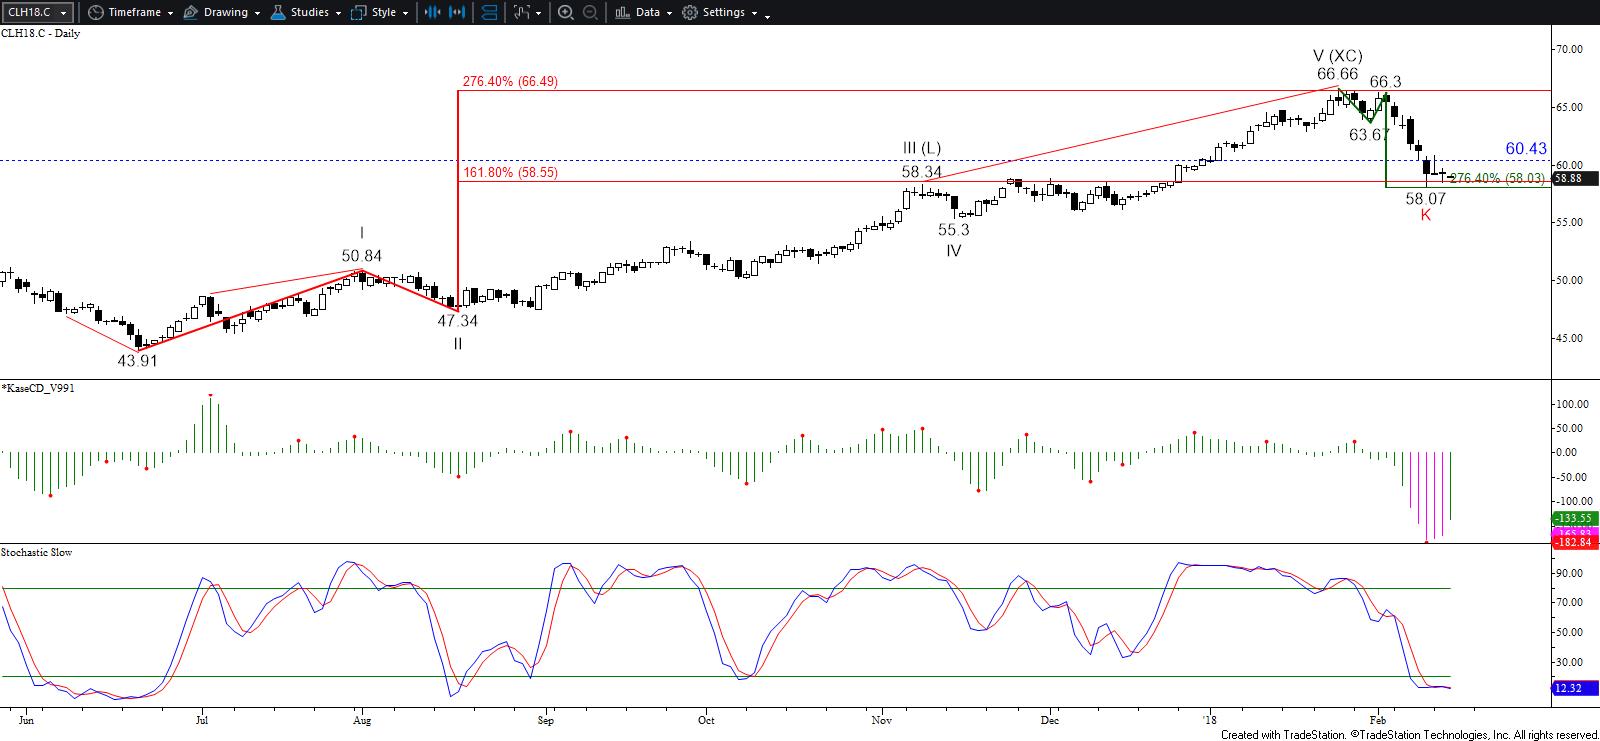
Initial support is the $58.39 swing low, and an early move below this tomorrow will call for $58.0, the smaller than (0.618) target of the wave $60.83 – 58.39 – 59.49. This is a key objective because it is the lowest that the initial wave down from $66.66 projection and is the 38 percent retracement of the move up from this past summer’s $43.91 swing low. Settling below $58.0 will open the way for $57.6 and very likely $57.1, the equal to (1.00) target of the wave down from $60.83.
Should the upward correction attempt to extend again tomorrow, look for initial resistance at last Friday’s $59.8 midpoint. This is the completion point of the morning star setup, a close above which would call for the $60.4 confirmation point. The $60.4 level is key for the near-term because it is also sitting just above the smaller than target of the wave up from $58.07. Settling above $60.4 would call for a likely move above the $60.83 swing high to $61.4, which is in-line with the equal to target of the wave up from $58.07 and the 38 percent retracement of the decline from $66.66.
This is a brief analysis for the next day or so. Our weekly Crude Oil Commentary and daily updates are much more detailed and thorough energy price forecasts that cover WTI, Brent, RBOB Gasoline, Diesel, and spreads. If you are interested in learning more, please sign up for a complimentary four-week trial.
The CL market has created in the daily last 9 and 13 down 4% weekly kagi turn (red shoulder) after a 20 trading week breakout upward from the 10/2017 date, this bull phase is looking towards new reaction highs towards over head supply levels into the lower $80.00 levels in the weeks ahead.
This correction in price towards the model running is now at an important 30 lot level a major buying level in size after its 1st phase over the 20 trading week breakout as well as the 20 trading month breakout in CL pricing.
The ago monthly low break recently is a longer term test of that 20 monthly high break out in 10/2017 suggesting a late 2005 pricing rally ahead.
Observing the coming 2-4 weeks as ahead a trading range in the near term will confirm that the next leg higher in CL will begin. Any, new high of recent of the last 3 week time frame suggest a much more aggressive market than 2005 and a market moving towards a 2007 or 1 second event.
{Sorry, can’t allow links to Google Docs on this site}
Have a great day ahead.
Thank you for your work.