Gold Price Forecast – September 24, 2020

Gold Technical Analysis and Near-Term Outlook

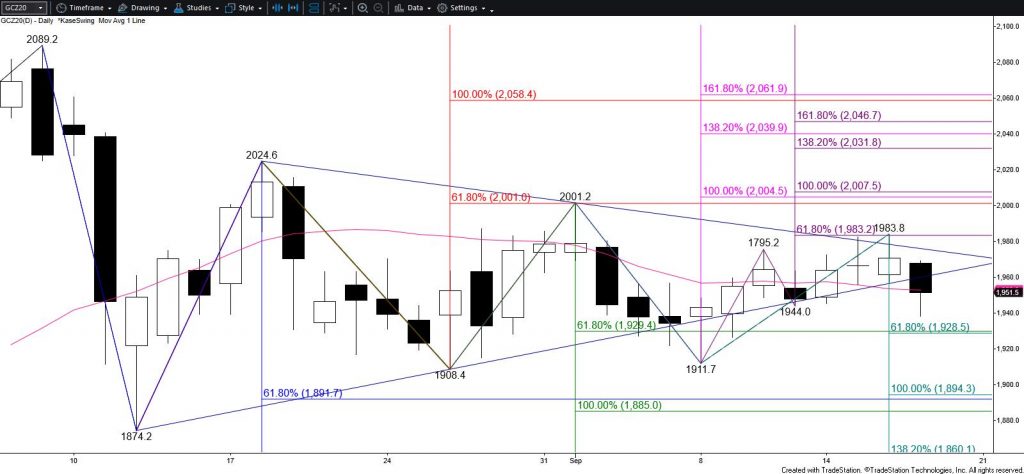
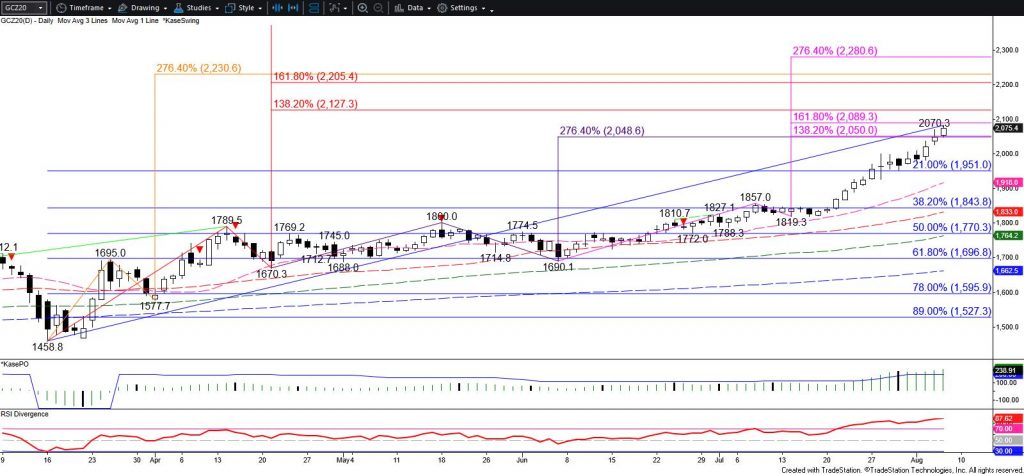
The outlook for December COMEX gold is bearish after breaking lower out of a coil pattern last week and settling below a crucial $1888 objective on Wednesday. The sustained close below $1888, the smaller than (0.618) target of the primary wave down from $2089.2, calls for gold to reach the $1810 equal to (1.00) target in the coming days.

Gold - $15 Kase Bar Chart
Gold – $15 Kase Bar Chart

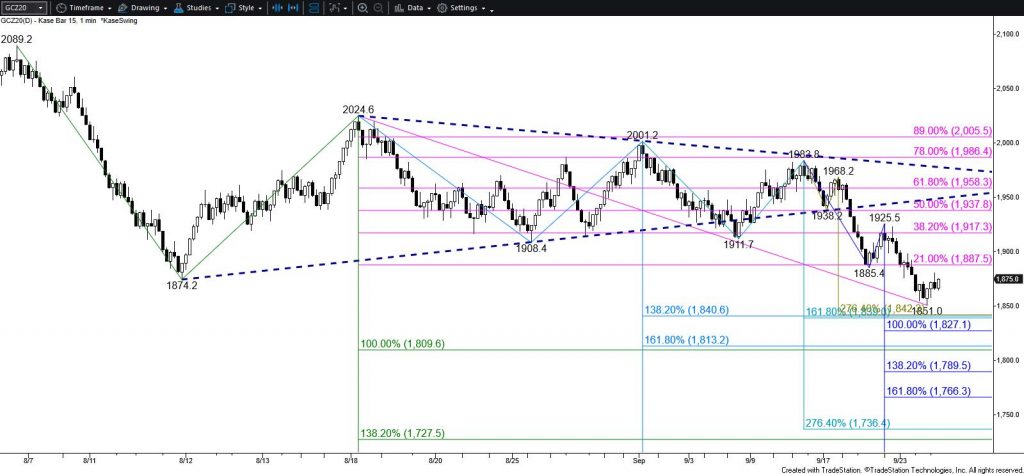
However, there is strong near-term support around $1843. This is the most confluent wave projection and is in line with the 38 percent retracement of the move up from $1458.8. Today’s formation of a hammer also suggests that a larger test of resistance might take place before the decline continues.

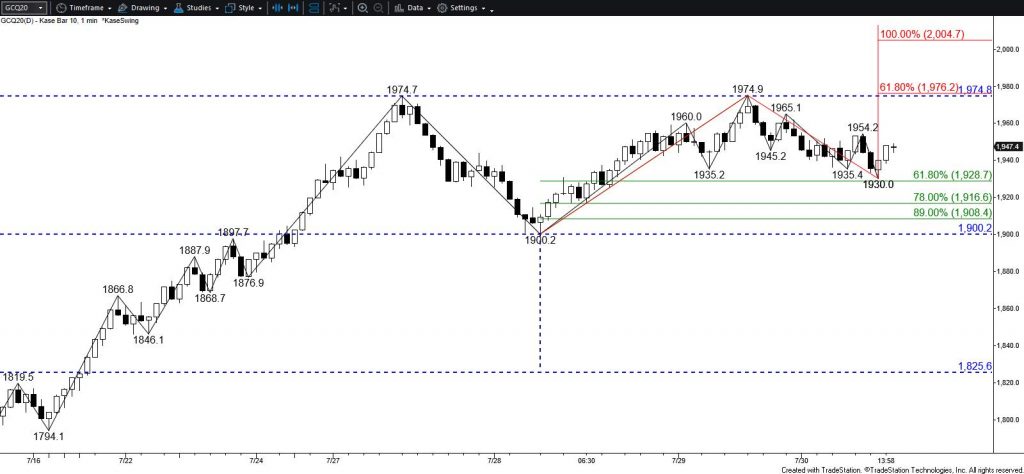
The $1888 level has become initial resistance and will likely hold. However, the increase in volatility during the past few days could help drive gold to challenge $1905. These are the completion and confirmation points for today’s hammer pattern, respectively. Settling above $1905 is doubtful but would dampen odds for a continued decline during the next few days and would shift near-term odds in favor of challenging $1930 and possibly $1954.

This is a brief analysis for the next day or so. Our weekly Metals Commentary and daily updates are much more detailed and thorough energy price forecasts that cover key COMEX precious metals futures contracts and LME Non-Ferrous (Base) metals, spot gold, the gold/silver ration, and gold ETFs. If you are interested in learning more, please sign up for a complimentary four-week trial.

Gold Technical Analysis and Near-Term Outlook

The near-term outlook for gold is bearish after finally breaking lower out of a coil pattern and settling below the pattern’s lower trend line. Gold also settled below the 20-day moving average. The move down is now poised to reach at least $1929. This is the smaller than (0.618) target of the wave down from $2001.2 and connects to a key objective at $1892 as the equal to (1.00) target. The $1892 objective is also the smaller than target of the primary wave down from $2089.2. Settling below this would be quite bearish for the outlook in the coming weeks.

Gold - Daily Coil
Gold – Daily Coil

Nevertheless, a move up at the end of the day suggests gold might test the lower trend line of the coil before the decline continues. Tomorrow, this trend line will intersect with $1964 resistance and is expected to hold. Rising above this would call for another attempt at $1983, the smaller than target of the wave up from $1911.7. Settling above $1983 would imply that today’s move down was another false breakout and would clear the way for $2005 and likely higher.

This is a brief analysis for the next day or so. Our weekly Metals Commentary and daily updates are much more detailed and thorough energy price forecasts that cover key COMEX precious metals futures contracts and LME Non-Ferrous (Base) metals, spot gold, the gold/silver ration, and gold ETFs. If you are interested in learning more, please sign up for a complimentary four-week trial.

Gold Technical Analysis and Near-Term Outlook

Gold is trading in a narrowing range that forms a coil pattern. Coils are not exceptionally reliable patterns like flags and pennants when it comes to determining a breakout direction. However, they lean in favor of a breakout in the direction of the prior move before the coil formed, in this case, down. A breakout of the coil should take place during the next few days.

Coils reflect uncertainty, which makes this is a very tight near-term call for gold right now. Even so, odds continue to lean in favor of a break lower. Falling below $1936 will call for $1820. This is the smaller than target of the wave down from $2001.2. Settling below this will confirm a break lower out of the coil and call for a test of $1888 and likely lower.

Gold - Coil on $15 Kase Bar Chart
Gold – Coil on $15 Kase Bar Chart

Nevertheless, gold briefly broke the coil’s lower trend line on Tuesday, but since then has challenged the 62 percent retracement of the decline from $2001.2 and the smaller than (0.618) target of the wave up from $1908.4. Prices also settled above the 20-day moving average today. These factors suggest the coil’s upper trend line around $1988 might be challenged before another test of support. Also, the wave up from $1908.4 calls for a test of $2002. Settling above $2002 would confirm a break higher out of the coil and clear the way for $2023 and likely $2041.

This is a brief analysis for the next day or so. Our weekly Metals Commentary and daily updates are much more detailed and thorough energy price forecasts that cover key COMEX precious metals futures contracts and LME Non-Ferrous (Base) metals, spot gold, the gold/silver ration, and gold ETFs. If you are interested in learning more, please sign up for a complimentary four-week trial

Gold Technical Analysis and Near-Term Outlook

Gold is trading in a narrowing range that forms a coil pattern. Coils reflect indecisiveness and are not the most reliable patterns. Even so, they generally break in the direction of the prior move, in this case, down.

Gold - Coil on $15 Kase Bar Chart
Gold – Coil on $15 Kase Bar Chart

Today’s decline to $1927.2 challenged the lower trend line of the coil and fulfilled the smaller than (0.618) target of the wave down from $2024.6. This is bearish and suggests that the move down should continue to the $1888 equal to target. This is in line with the smaller than (0.618) target of the primary wave down from $2089.2. Settling below $1888 will call for a more significant decline.

Nevertheless, the move up to $2001.2 earlier in the week fulfilled the smaller than target of the wave up from $1874.2. This wave positive because this wave connects to $2059 and higher. The coil pattern may be building a bullish base, but until gold settles above $2001, the near-term outlook will continue to lean bearish.

This is a brief analysis for the next day or so. Our weekly Metals Commentary and daily updates are much more detailed and thorough energy price forecasts that cover key COMEX precious metals futures contracts and LME Non-Ferrous (Base) metals, spot gold, the gold/silver ration, and gold ETFs. If you are interested in learning more, please sign up for a complimentary four-week trial.

Gold Near-Term Outlook

The near-term outlook for December gold futures leans bearish. Gold initially rose to $1980 as expected today. However, this level, which is in line with the 62 percent retracement of the decline from $2024.6 and the 20-day moving average, held on a closing basis. Also, the subsequent move down from today’s $1987.0 high fulfilled the $1915 smaller than (0.618) target of the wave down from $2024.6. Therefore, odds favor a continued decline, and a move below $1915 will clear the way for $1891 and lower.

Gold - $10 Kase Bar Chart
Gold – $10 Kase Bar Chart

Nevertheless, trading has been erratic for the past few days. So far, the move up from $1914.7 has held the 38 percent retracement of the decline from $1987.0. However, should gold rise a bit higher first, look for resistance at $1961 to hold. Closing above this would shift near-term odds in favor of key resistance at $1997. This is the equal to (1.00) target of the wave up from $1908.4 and, more importantly, the smaller than target of the wave up from $1874.2. Settling above $1997 would call for gold to make a push for at least $2023 and likely higher next week.

This is a brief analysis for the next day or so. Our weekly Metals Commentary and daily updates are much more detailed and thorough energy price forecasts that cover key COMEX precious metals futures contracts and LME Non-Ferrous (Base) metals, spot gold, the gold/silver ration, and gold ETFs. If you are interested in learning more, please sign up for a complimentary four-week trial.

Gold Near-Term Outlook

December gold’s move up today is most likely corrective of yesterday’s decline. Near-term odds continue to favor a larger move down because of the daily and weekly reversal patterns and signals that were confirmed during the pullback from the $2089.2 swing high. A move below $1942 early tomorrow will increase odds for challenging $1932 again. This is the 62 percent retracement of the rise from $1874.2, a close below which will call for $1907 and then the key objective at $1892. Settling below $1892 will call for a much more significant test of support before gold tries to rise again.

Gold – $10 Kase Bar Chart

Nevertheless, based on the intra-day waves up from $1928.9, there is a good chance for a test of $1975 and possibly $1988 before gold challenges $1932 again. Resistance at $1988 is expected to hold. Closing above this will call for $2011 and possibly $2022. The $2022 threshold is most important because this is the smaller than (0.618) target of the wave up from $1874.2. Settling above $2022 would imply that the corrective move down is most likely complete and that the move up will begin to extend toward new highs again.

This is a brief analysis for the next day or so. Our weekly Metals Commentary and daily updates are much more detailed and thorough energy price forecasts that cover key COMEX precious metals futures contracts and LME Non-Ferrous (Base) metals, spot gold, the gold/silver ration, and gold ETFs. If you are interested in learning more, please sign up for a complimentary four-week trial.

Gold Near-Term Outlook

Gold was due for a significant test of support, the beginning of which took place on Tuesday. The move down from $2089.2 retraced just over 50 percent of the move up from $1690.1. While this aggressive move down was bearish for the near-term outlook, the move up during the past two days implies that the decline will probably prove to be corrective of the larger scale move up.

It is too soon to call for the correction to be complete. However, based on today’s move up to fulfill the $2073 smaller than (0.618) target of the primary wave up from $1874.2, a larger test of resistance is expected tomorrow. Rising above $1973 will clear the way for $1991 and likely $2007. The $2007 objective is the equal to (1.00) target of the wave up from $1874.2 and the 62 percent retracement of the decline from $2089.2. Settling above $2007 would signal that the correction might already be complete and would clear the way for $2020, $2040, and $2065 early next week.

Gold – $10 Kase Bar Chart

Nevertheless, given the number of reversal signals that were confirmed on the daily and likely the weekly chart tomorrow, there is a good chance that $2007 will hold, at least initially.

Conversely, should $2073 continue to hold and upon an early move below $1936 tomorrow, look for a test of key near-term support at $1913. Settling the week below $1913 will call for prices to fall toward $1885 and ultimately major support at $1845 early next week.

This is a brief analysis for the next day or so. Our weekly Metals Commentary and daily updates are much more detailed and thorough energy price forecasts that cover key COMEX precious metals futures contracts and LME Non-Ferrous (Base) metals, spot gold, the gold/silver ration, and gold ETFs. If you are interested in learning more, please sign up for a complimentary four-week trial.

Gold Near-Term Outlook

The December 2020 gold futures contract finally settled above the crucial $2050 target today. This is bullish for the near-term outlook and clears the way for at least $2091 and possibly $2130. These are the next potential stalling points because they are the larger than (1.618) target of the primary wave up from $1690.1 and the intermediate (1.382) target of the primary wave up from $1458.8, respectively.

Gold – Daily Candlesticks with RSI and KasePO Momentum Oscillators

The daily RSI and KasePO momentum oscillators are overbought. Otherwise, there are no confirmed bearish reversal patterns, signals, or setups that call for the move up to stall before reaching at least $2091.

Nevertheless, should gold fall below $2049 look for a test of $2021. This is the 38 percent retracement of the move up from the last major intra-day swing low of $1927.5. Support at $2021 is expected to hold. Settling below this will call for a deeper test of support where $1990, the 62 percent retracement, is most important for the near-term outlook.

This is a brief analysis for the next day or so. Our weekly Metals Commentary and daily updates are much more detailed and thorough energy price forecasts that cover key COMEX precious metals futures contracts and LME Non-Ferrous (Base) metals, spot gold, the gold/silver ration, and gold ETFs. If you are interested in learning more, please sign up for a complimentary four-week trial.

Gold Price Forecast

The long-term outlook for gold remains bullish. However, August gold futures formed a double top at yesterday’s $1974.9 swing high. Gold had also formed daily high wave candlesticks (or long-legged dojis) earlier in the week that implied the move up was nearing exhaustion. Today’s bearish engulfing line, a KCDpeak, and a KasePO PeakOut (confirmed overbought momentum oscillator signals) call for a test of $1929 and likely $1900 before the move up continues.

Gold – $10 Kase Bar with Double Top

The $1929 objective is the 62 percent retracement of the rise from $1900.2. This target was tested and held today when gold fell to $1930.0. Therefore, it may prove to be strong support.

The $1900 target is in line with the $1900.2 confirmation point of the double top. Settling below $1900 will confirm a larger reversal is underway and would call for a deeper correction to $1859 and possibly to the double top’s $1826 target ($1900.2 – ($1974.8 – $1900.2)).

Nonetheless, the move down is most likely corrective because ultimately the larger scale waves, sub-waves, and compound waves up from $1454.8 call for $2003. Should gold hold $1929 and overcome $1958 look for a test of $1976. Closing above this will call for gold to reach $2003 before possibly stalling again.

This is a brief analysis for the next day or so. Our weekly Metals Commentary and daily updates are much more detailed and thorough energy price forecasts that cover key COMEX precious metals futures contracts and LME Non-Ferrous (Base) metals, spot gold, the gold/silver ration, and gold ETFs. If you are interested in learning more, please sign up for a complimentary four-week trial.

Gold Price Forecast

Gold’s move up finally accelerated this week after breaking higher out of a rectangle pattern on June 30 and then a throwback to test the $1790 breakout point on July 14. The move up has easily overcome targets around $1840 and $1871 this week but stalled this afternoon near $1898. Based on the wave structure, $1898 is a relatively minor target, and odds still favor a move above this to the next major objective at $1912. The $1912 objective is most important because it is the intermediate target of the first wave up from $1694.9 and is in line with the rectangle’s $1909.6 target ($1789 + ($1789 – $1668.4) = $1909.6). Therefore, once $1912 is met another modest test of support is expected before the move up continues.

Gold Targets $1912

There are no confirmed bearish reversal patterns or signals that call for a major test of support before reaching $1912. Nevertheless, the daily RSI and KasePO momentum oscillators have risen into overbought territory. This warns that a test of support will probably take place soon and suggests that $1912 will hold, at least initially.

The small move down from the $1898 confluence point also warns that a small test of support might take place before gold reaches $1912. Support at $1872 is expected to hold and $1853 is key for the near-term. Settling below $1853 would call for $1831 and possibly $1808 before gold rises toward $1912 again.

This is a brief analysis for the next day or so. Our weekly Metals Commentary and daily updates are much more detailed and thorough energy price forecasts that cover key COMEX precious metals futures contracts and LME Non-Ferrous (Base) metals, spot gold, the gold/silver ration, and gold ETFs. If you are interested in learning more, please sign up for a complimentary four-week trial.