On Oct. 30, a colleague called frantically about 10-year German government bonds taking a major reversal after weak German business confidence data had been released. He was having difficulty gauging the importance of the news, and hoped that technicals would put the talking-head chatter into perspective, something fundamentals alone couldn’t do.
I plotted a daily candlestick chart with the RSI, MACD and Stochastic. GDBR10 had been in a downward oscillating trend for decades, interrupted by prolonged corrections, the latest of which ended in mid-January. The recent run up lasted eight days, so just from a duration standpoint, it wasn’t much of a recovery. Days six and seven formed a bearish Harami line and star. Oct. 27 closed below the midpoint of the Oct. 23 Harami line, indicating that the pattern was complete. So, even without indicators the candles showed a clear bearish pattern.
Candlesticks Showed Bearish Signal Before Other Indicators
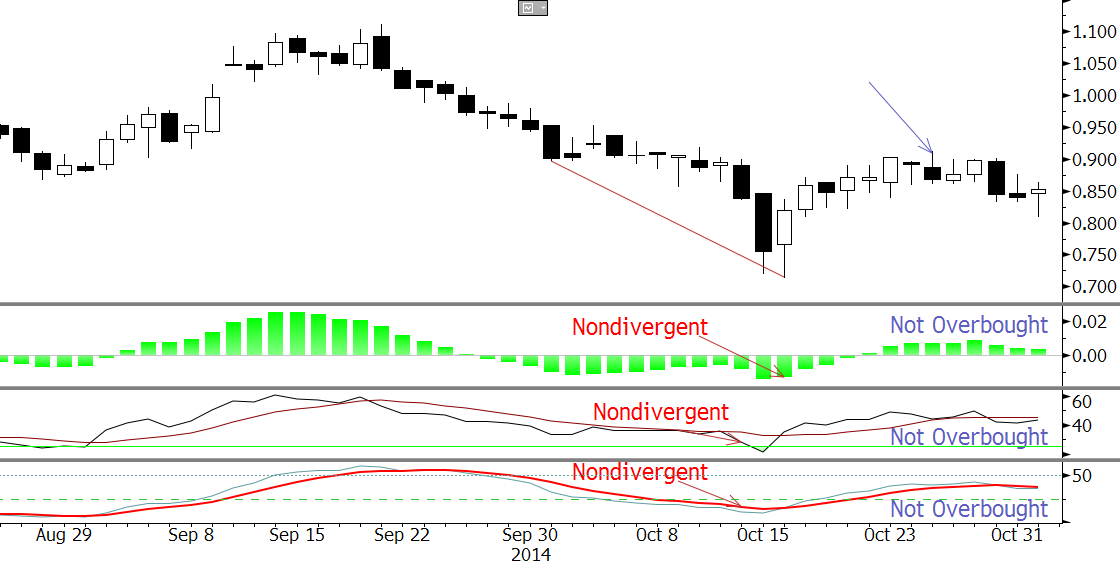
However, none of the indicators were either divergent or overbought. This is a key fault of these indicators in that they are “unidirectional” — when they trigger the follow through is good, but they often lack signals ahead of turns.
These common indicators were originally for calculators, not computers. The solution is to use new approaches which employ computationally intense algorithms to optimize for serial dependency, cycle length, and scale for logarithmic volatility. This results in bi-directional indicators and statistically significant stops, such as the KaseCD and Kase DevStops.
The KaseCD goes magenta when it’s overbought or oversold, as on Oct. 27, warning of a possible turn. Anyone long the eight day rally should have become increasingly cautious, especially as the following days were sideways. This would have meant scaling back a long position, or perhaps selling covered calls.
KaseCD Turned Magenta to Signal Overbought Level
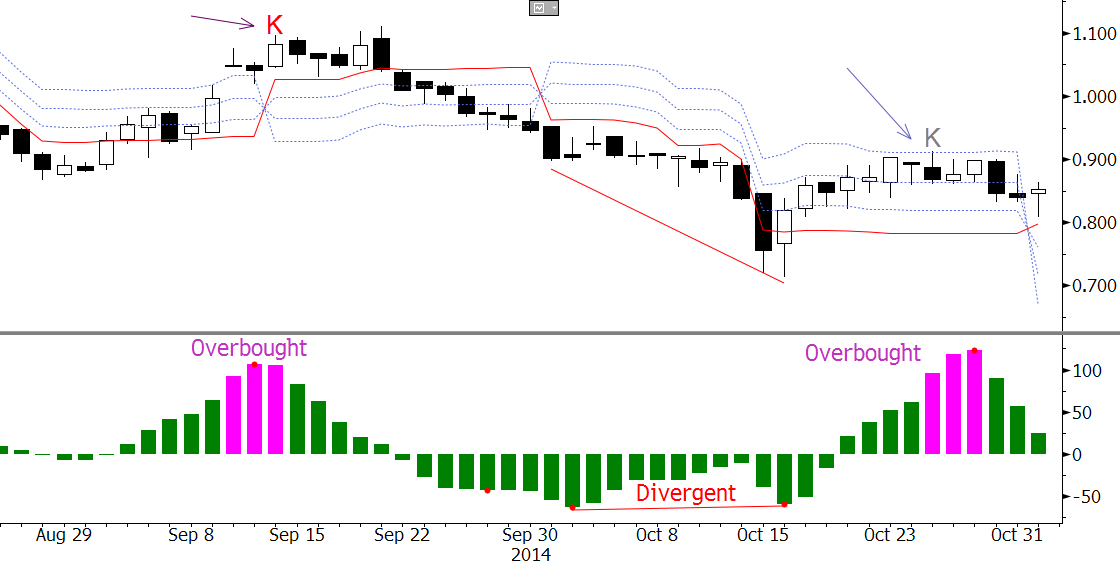
Earlier signals missed on the first chart were caught as well. Oct. 16’s turn was clearly signaled by a KCD momentum divergence, as marked by the automatically generated red divergence lines. The mid-September decline was signaled by the KCD overbought “K.”
Cynthia Kase, President
President
Kase and Company, Inc.
For a no-charge trial of Kase StatWare on Bloomberg visit APPS CS:KASE, which includes the KaseCD and Kase DevStops, contact us if you have any questions.