Natural Gas Technical Analysis and Near-Term Outlook
This is a brief analysis for the next day or so. Our weekly Natural Gas Commentary and daily updates are much more detailed and thorough energy price forecasts that cover key natural gas futures contracts, calendar spreads, the UNG ETF, and several electricity contracts. If you are interested in learning more, please sign up for a complimentary four-week trial.
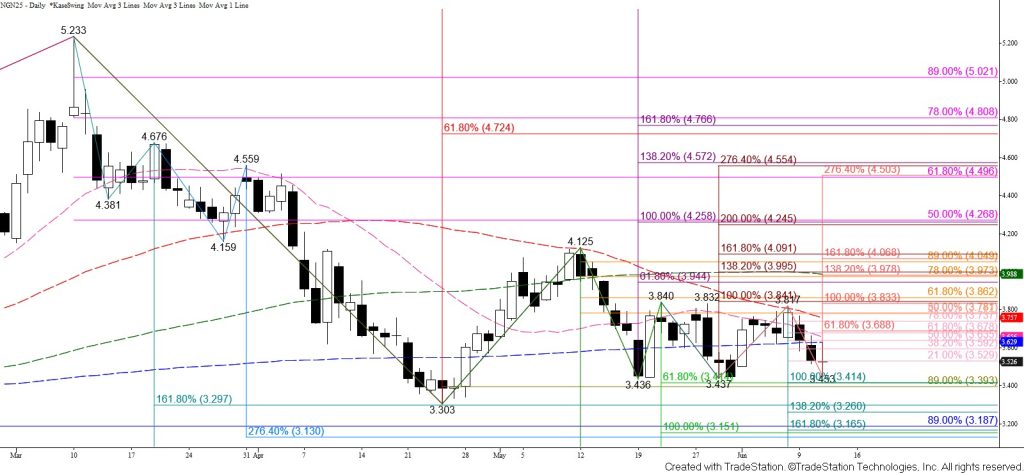
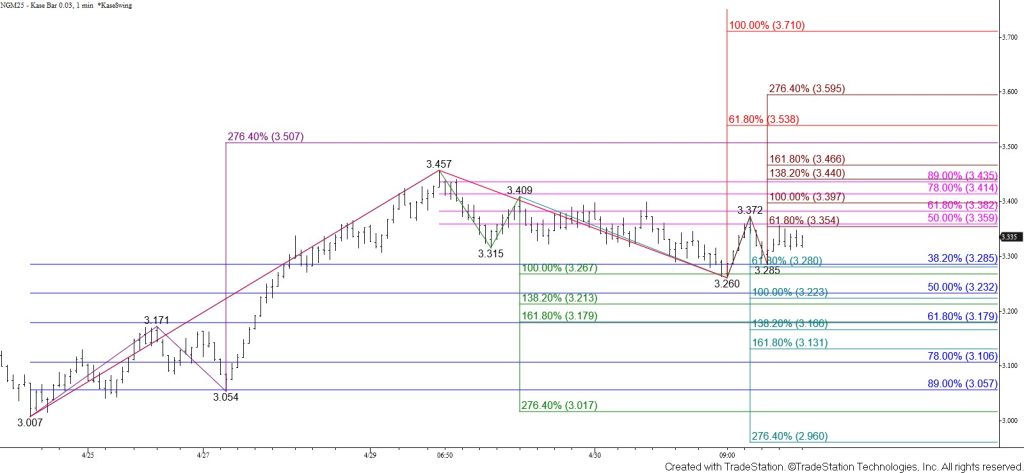
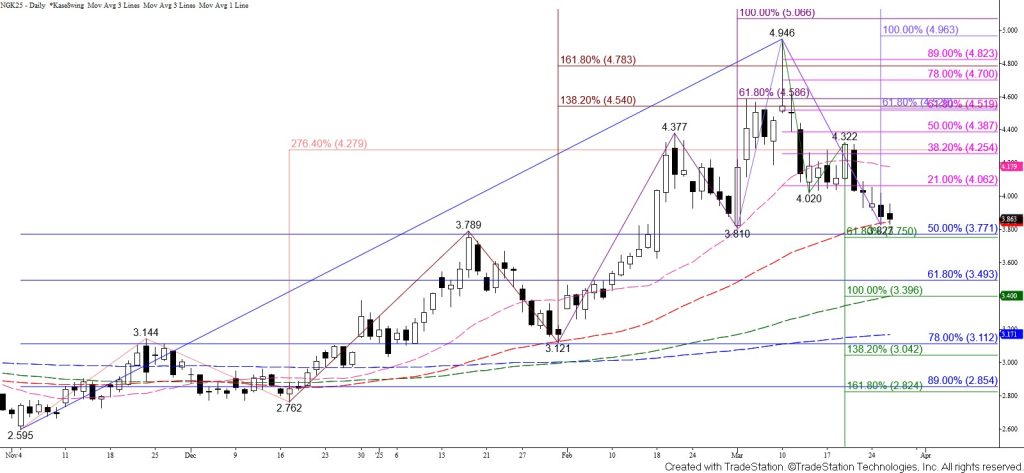
July natural gas is trading in a range between $3.44 and $3.84. Entering the week, prices had been poised to test the $3.84 confirmation point of a double bottom that formed around $3.44. However, prices have fallen back to test the lower threshold of the range during the past few days. The wave down from $3.840 calls for a test of its $3.41 equal to (1.00) target, which is also in line with the smaller than (0.618) target of the wave down from $4.125. The connection to $3.41 is made through a minor target at $3.45. Settling below $3.41 will confirm a break lower out of the range, opening the way for a test of the $3.303 swing low.
That said, today’s long-legged doji reflects uncertainty and warns that prices could remain bound within the range as traders wait for more information. Should prices rise within the range again and overcome $3.58, look for a test of $3.63 and possibly key near-term resistance at $3.69. Settling above $3.69, which is the smaller than target of the wave up from $3.437, would put the odds back in favor of July natural gas rising to challenge the top of the range at $3.84.